AI Brands: The Next Big Thing

The Next Phase of AI Enablement Has Already Begun:

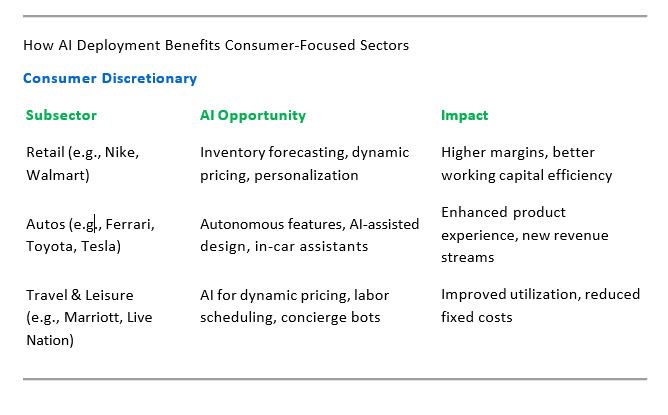
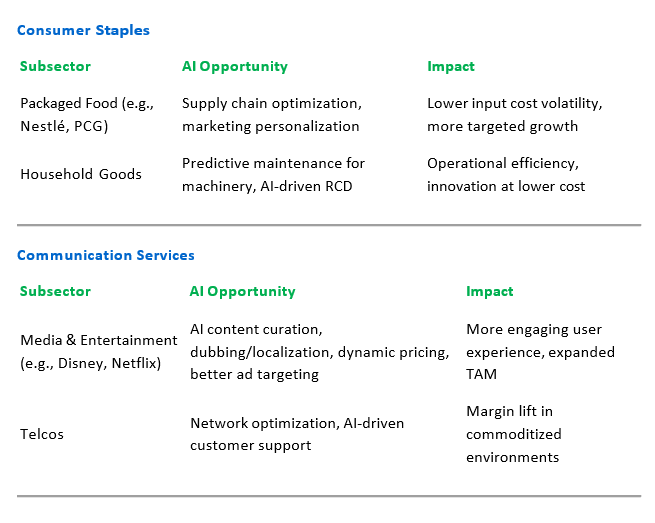
As investors pile into technology stocks amid the AI revolution, a critical inflection point is emerging — the shift from AI infrastructure buildout to mass enterprise deployment. While semiconductor and hyperscaler names have dominated early returns, the next and potentially more durable phase of value creation will come from AI’s application across traditional industries & sectors. Remember, it’s the companies with the most robust data that will likely receive the disproportionate benefits from AI deployment. Consumer companies have massive amounts of data on their customers and this data + AI inferences can drive incredible benefits to customers and leading brands. For investors like us — focused on global household consumption and the enduring strength of brand-driven businesses — this shift represents a compelling opportunity. As AI tools move beyond labs and data centers into real-world operations, many companies historically seen as lower-growth or having structurally lower-multiples stand to benefit from a wave of productivity, profitability, and ultimately, multiple expansion.

Consider this:

There’s about $3 trillion invested in technology-focused ETF’s alone. Most core and growth indexes have technology as the highest weighted sector as well. Whether they realize it or not, investors have an enormous overweight position to technology. Thank heavens many of the leading tech brands are highly profitable and quality businesses but the reality is, a typical portfolio is wildly underweight many other sectors and opportunities. Imagine if just a fraction of the trillions invested in technology shares decided to invest in other sectors that are sure to benefit from AI deployment. The Consumer Discretionary & Staples sectors combined have less than $100B in assets. When the evidence of these benefits arrives to non-tech companies, there’s a very large wave of capital coming to a much smaller shore, which is sure to have a disproportionate effect on the companies that innovate the most.


Let’s analyze the 30,000-foot view on AI and where we are today.

We see two phases of the AI revolution thus far:

1. The Buildout Phase: started in 2019

This phase was characterized by:

• Explosive demand for AI infrastructure: GPUs, accelerators, custom silicon.

• Capex surges by hyperscalers to build AI-ready data centers.

• Strong returns for chipmakers (e.g., NVIDIA, Broadcom), cloud platforms, and power/utility providers.

2. The Deployment Phase: started 2024

This phase will be marked by:

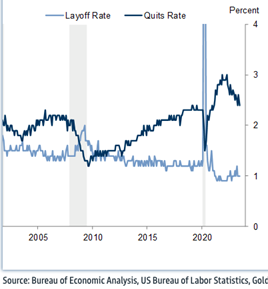
• Mass enterprise integration of AI tools into workflows.

• A sharp rise in productivity, cost savings, and customer personalization.

• Margin expansion and renewed earnings growth across non-tech sectors.

• Early development & deployment of AI agents (Agentics).

• Capital shifting from tech-heavy names to the broader economy making “the rest of the market” a more intriguing investment than it’s been in many years.


Why This Matters to Global Brands Investors

We have long prioritized companies with:

• Durable demand factors tied to global household consumption.

• High brand relevance and global pricing power.

• Sustainable economic moats, stronger balance sheets, & global opportunities.

Many dominant brands trade with lower average multiples when compared to most technology stocks. That dynamic is about to change for brands with vision, capex to deploy, and an eye for AI efficiencies

The Hidden Alpha: Multiple Expansion in Lower-Multiple Sectors

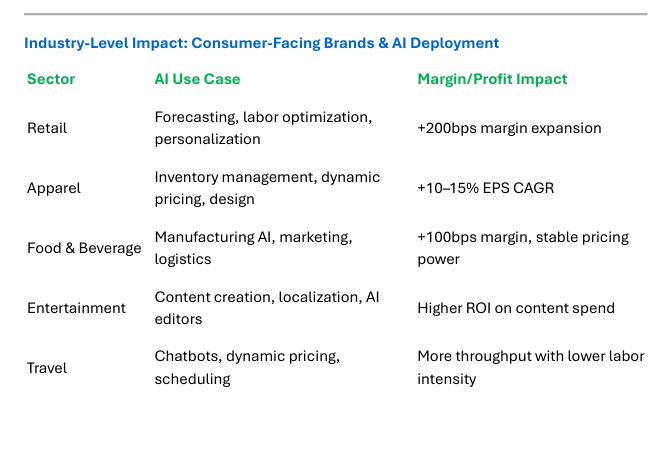
With AI improving operating leverage and compressing cost structures, industry leaders outside the technology sector are poised to:

• Deliver faster earnings growth.

• Unlock operating leverage while generally keeping headcount flat.

• Improve FCF yields with higher ROIC.

• Improve margins & profitability meaningfully.

As AI-powered companies show similar growth rates & never-before-seen operating leverage, but from a lower base — the re-rating potential is meaningful. For now, very few investors are focused on this inevitability. That makes our team excited to be early to this party.


Capital Flows Are Poised to Shift

The setup:

• Technology has become over-owned and increasingly crowded with >$3 trillion in ETF AUM alone. Plus, tech is >35-50% in many growth & core indices.

• AI tailwinds will begin flowing into other sectors.

• Active managers are looking for laggard plays on AI with better valuation upside.

This creates a window where capital will rotate into quality brands and consumer-facing names that show tangible AI deployment benefits. We already see tangible signs of AI benefits in brands like: Walmart, Amazon, Mercado Libre, Spotify, Netflix, Uber, Microsoft, Tesla, American Express, Blackstone, Apollo, KKR, Booking Holdings, Service Now, Coca Cola, Goldman Sachs, CBRE, Draftkings, Shopify, Intuit, Caterpillar, Robinhood, with much more to come.


Brand Case Studies: AI Driving Profits and Re-Rating

1.  Walmart (P/E ~24x)

AI Deployment:

·         Real-time inventory management with generative AI forecasting.

·         Automated supplier negotiations using AI bots.

·         Labor scheduling optimization in warehouses and stores.

·         Higher customer engagement C cross-selling opportunities.

Result:

·         Improved inventory turns, lower shrinkage, and optimized labor costs.

·         Potential margin expansion of 150–200bps over 3 years.

·         As EPS grows faster than the long-term average and the multiple re-rates higher due to better profitability, stock price could appreciate 50%+ from current levels.

·         At the current $700B in annual revenues, we expect Walmart to join the $1 trillion club on its current trajectory. Implementing more AI tool could accelerate this trip.


2.  Amazon Retail

AI Deployment Areas:

1.      Personalization & Recommendations

o    AI refines product search, cross-selling, and bundle suggestions based on user behavior.

o    Improves conversion rates and increases average order value (AOV).

2.      Dynamic Pricing & Promotions

o    Algorithmic pricing adjusts in real-time to competitor prices, supply chain constraints, and customer behavior.

o    Enhances margins without losing market share.

3.    Logistics & Inventory Optimization

o    Machine learning predicts demand and optimizes warehouse placement and delivery routes.

o    Reduces shipping costs and improves delivery speed.

4.       Customer Support Automation

o    AI chatbots reduce reliance on human reps while increasing resolution speed.

o    Lower SGCA costs and improved customer satisfaction.

5.      Robotics & Fulfillment Automation

o    Expanding use of warehouse robotics and AI-assisted sorting reduces labor intensity per package.

o    Lowers cost per unit and supports scale without headcount growth.

Amazon Web Services (AWS):

AI Deployment Opportunities:

1.      Foundational Infrastructure

o    AWS provides compute and storage for model training and inference.

o    Leader in custom silicon (e.g., Trainium, Inferentia) tailored to AI workloads.

2.      AI-as-a-Service (AaaS)

o    Sagemaker, Bedrock, and Q democratize access to LLMs and fine-tuning.

o    Broadens AWS's customer base to include SMBs, enterprises, and developers who can't build in-house.

3.      Verticalized AI Tools

o    AWS provides tailored solutions to healthcare, fintech, retail — creating industry-specific moat

o    Enhances stickiness and increases “per-customer spend”.

4.      Global Hyperscaler Share Gain

o    As AI drives global capex, hyperscaler spend accelerates — AWS captures significant share via compute contracts and data migration.

Result:

·         Amazon Retail operating margins continue to expand as cost to serve falls.

·         EPS accelerates to high teens over 5 years.

·         AWS revenue re-accelerates from mid-teens to 20%+ CAGR.

·         Margins remain high and expand further, even with high cap-ex commitments.

·         Overall, margins expand, operating leverage improves, headcount stays contained, profitability balloons, stock has meaningful re-rating higher.

1.    Netflix

AI Deployment Areas:

1.      Personalized Content Discovery

o    AI refines the recommendation engine with LLM-enhanced user profiles, mood detection, and context-aware suggestions.

o    Results in longer watch times, reduced churn, and better content ROI.

2.      Localized Content Creation

o    AI dubbing, voice cloning, and real-time subtitle generation allow global releases at scale.

o    Lowers cost of localization while increasing international appeal and velocity of new releases.

3.      Script & Production Optimization

o    AI-assisted tools identify story arcs, sentiment analysis, pacing, and character modeling.

o    Enhances hit rate of originals and trims development cycles and production waste.

4.      Dynamic Ad Targeting (Netflix’s Ad Tier)

o    AI tailors’ ads by viewer behavior, geography, device, and content type.

o    Yields better monetization per user.

5.      Churn Prediction & Pricing Optimization

o    Machine learning predicts the likelihood of churn and adjusts retention offers or suggests pricing tier adjustments.

o    Improves net subscriber retention and average revenue per user (ARPU).


Conclusion: AI adoption is a 1st inning opportunity for investors.

For now, all investors seem to want is technology stocks. Keep your eye on the prize: We believe the next AI leaders will not just be those building the tools — but those using them to transform their businesses. This spans industries and the most innovative companies could see meaningful re-ratings as the benefits show up in earnings results.

The opportunity ahead for global brand investors is to identify:

·         Trusted consumer franchises.

·         With the will and ability to deploy AI at scale.

·         In ways that improve margin structure, ROIC, and brand equity.

The AI revolution may have started in Silicon Valley. But its longest-lasting impacts will be felt in the aisles, screens, homes, and experiences that define global consumption.


Carefully consider the Fund’s investment objectives, risks, charges, and expenses before investing. This and other information can be found in the Fund’s statutory and summary prospectuses, which may be obtained at LogoETF.com. Read the prospectus carefully before investing. Equity Market Risk. By virtue of the Fund’s investments in equity securities, the Fund is exposed to common stocks which subjects The Fund to equity market risk. Common stocks are generally exposed to greater risk than other types of securities, such as preferred stock and debt obligations, because common stockholders generally have inferior rights to receive payment from specific issuers. Equity Securities may experience sudden, unpredictable drops in value or long periods of decline in value. Foreign Securities Risk. Investments in securities or other instruments of non-U.S. issuers involve certain risks not involved in domestic investments and may experience more rapid and extreme changes in value than investments in securities of U.S. companies. Financial markets in foreign countries often are not as developed, efficient, or liquid as financial markets in the United States, and therefore, the prices of non-U.S. securities and instruments can be more volatile. Economic and Market Risk. Economies and financial markets throughout the world are becoming increasingly interconnected, which increases the likelihood that events or conditions in one country or region will adversely impact markets or issuers in other countries or regions. Securities in the Fund’s portfolio may underperform in comparison to securities in the general financial markets, a particular financial market, or other asset classes, due to a number of factors, including inflation (or expectations for inflation), deflation (or expectations for deflation), interest rates, global demand for particular products or resources, market instability, financial system instability, debt crises and downgrades, embargoes, tariffs, sanctions and other trade barriers, regulatory events, other governmental trade or market control programs and related geopolitical events. Models and Data Risk. The Sub-Adviser’s evaluation of potential Fund portfolio holdings is heavily dependent on proprietary quantitative models as well as information and data supplied by third parties (Models and Data). When Models and Data prove to be incorrect or incomplete, any decisions made in reliance thereon may lead to the inclusion or exclusion of securities from the Fund’s portfolio that would have been excluded or included had the Models and Data been correct and complete. New Fund Risk. The Fund is a recently organized management investment company with no operating history. As a result, prospective investors do not have a track record or history on which to base their investment decisions. Investing involves risk, including possible loss of principal. Distributed by Foreside Fund Services, LLC

Consumer Brands - Getting Fit in Turmoil

August 2025

Eric M. Clark, CIO

How Leading Consumer Brands Emerged Leaner, Stronger, and More Valuable from 2019–2025. LOGO’s Matter.

The last five years have been among the most intense stress tests in modern business history. Consumer brands have faced a relentless series of macro shocks — each one forcing operational reinvention: - 2020–2021: Global pandemic, supply chain breakdowns, inventory mis-alignments, above-trend consumption from government payments, and rapid shifts in consumer behavior. - 2022–2023: 50-year-high inflation and the fastest interest rate hike cycle in modern history caused tremendous damage to consumer sentiment with stocks & bonds crashing in 2022. - 2024–2025: New trade tariffs, potential squeeze of margins for brands that import goods, more inventory management lumpiness and lingering effects of inflation driving consumers to want even more value from brands. For most of the 2010s, consumer companies operated in a benign environment — stable interest rates, modest inflation, reliable supply chains, and predictable consumer spending. As you might image, the Consumer Discretionary Sector Index showed stellar performance from March 9, 2009, to January 1, 2020, with a 22.7% annualized return versus the S&P 500 Index at 17.85% over that period.

Since the end of 2019, the stable conditions that allowed for strong returns have been a bit more infrequent. One would expect the returns of the stocks involved to also be potentially lumpy. Here’s the data: over the trailing 3 years ending August 14, 2025, the Consumer Discretionary Sector shows a rare & significant underperformance period of annualized returns at 11.51% versus the S&P 500 Index at 16.34%, largely due to the strong returns in the tech sector versus other sectors.

Here's the opportunity today for investors.

Not every company thrives when conditions are more difficult, but brands with high brand relevancy, pricing power, and balance sheet strength come out the other end of turmoil leaner, more operationally fit, and more profitable than at any time in their history. And as conditions normalize, these are the kinds of companies well positioned to command higher valuations than they’ve historically enjoyed. As AI deployment gains momentum across

industries, the companies that were forced to run more efficiently and that deploy AI tools to drive even better operating efficiencies, will begin reporting superior metrics. The re-rating could be sharp and swift. If you follow Shopify, the leading brand powering other companies’ e-commerce efforts, you have seen what these positive earnings surprises do to a stock’s valuation. More are sure to follow.

Here's how great brands respond to adversity and why the turmoil can lead to long-term competitive advantages:

1. The Pandemic as an Accelerated Fitness Test

When COVID-19 shut down economies in early 2020, consumer brands had to rewrite their playbooks overnight. The challenges: - Store closures and foot traffic collapses. - Supply chain disruptions from Asia to Europe. - Surging e-commerce demand creating fulfillment bottlenecks. - Rapid shifts in consumer preferences (home goods up, formal apparel down). How leading brands responded: - Operational agility: Retailers like Nike and Lululemon accelerated direct-to-consumer digital investments that were planned over years into months. - Product line optimization: Companies shed slow-moving SKUs to focus on high-turn, profitable items. - Supplier diversification: Brands reduced dependence on single geographies, building redundancy and flexibility. By mid-2021, the best operators weren’t just surviving — they had transformed bloated supply chains into lean, responsive networks.

2. Inflation Shock and the Return of Pricing Power

As economies reopened, pent-up demand collided with supply shortages. Inflation soared to levels not seen in 50 years, peaking above 9% in the U.S. in mid-2022. The challenges: - Input costs for raw materials, freight, and labor surged. - Consumers faced higher prices for essentials, compressing discretionary spending. How leading brands responded: - Dynamic pricing strategies: Leaders like Procter & Gamble, Chipotle, McDonalds, Mondelez implemented multiple price hikes, paired with smaller pack sizes or product innovation to preserve volumes. - Efficiency drives: Every dollar of spend was re-evaluated — from marketing channels to manufacturing processes — to offset cost pressures.

- Brand equity leverage: Strong consumer loyalty enabled premium brands to raise prices without losing share. The result? Many leading consumer companies not only passed on costs but expanded gross margins, proving that strong brands can maintain pricing power even in inflationary environments.

3. Interest Rates and the Higher Cost of Capital

From near-zero in 2021, U.S. interest rates climbed above 5% by 2023 — the fastest pace in decades. The challenges: - Debt refinancing costs surged. - Leveraged acquisitions became more expensive. - Consumer sentiment fell to the floor & value-seeking became the norm.

How leading brands responded: - Balance sheet discipline: Many reduced leverage to avoid expensive refinancing. - Capex selectivity: Investment dollars were funneled only into projects with the highest returns or strategic necessity. - Product lineups were re-assessed, and suppliers were asked to give up some margins to serve value-oriented consumers. This discipline created companies with cleaner balance sheets and higher return thresholds — a structural improvement that will persist even when rates decline.

4. The Tariff Layer: 2024–2025 Trade Shocks

Just as inflation and rates stabilized, new rounds of tariffs were announced, targeting imports from major manufacturing hubs. The goods sector and the stocks tied to it took a meaningful hit on the news, many of which continue to struggle as pricing power has become more difficult. The challenges: - Input costs rose again, particularly in categories dependent on overseas manufacturing. - Supply chains faced renewed complexity.

How leading brands responded: - Local sourcing acceleration: More manufacturing and assembly was moved closer to the end market. - Supplier diversification 2.0: Companies had already learned in 2020–2021 not to rely on single points of failure — now they doubled down. - Product redesign for tariff optimization: Some altered materials, origin points, or assembly

processes to reduce tariff exposure. Far from starting from scratch, the capabilities built during the pandemic — agility, supplier diversity, rapid product iteration — became the toolkit for this new challenge.

5. Why These Shocks Create More Valuable Companies

Each of these events — pandemic, inflation, rising rates, and tariffs — has forced consumer brands to operate with unprecedented discipline. They have streamlined supply chains, optimized SKUs, reinforced pricing power, strengthened balance sheets, and improved capital allocation discipline.

And then there’s the eventual AI deployment that will happen across sectors and industries. Headcounts will stay flat or fall, productivity will increase, profit margins will increase, revenue per employee will rise, customer engagement should rise, and overall profits and free cash flow will rise. You know what happens to stock prices generally when important operating metrics rise sustainably? When a company tends to trade at a 13-16x multiple and operating metrics rise and sustain at the new level, the multiple re-rates higher. It’s coming folks, we’ve already seen some examples and the re-ratings have been massive. As an investor, you generally want to get ahead of catalysts with this size and scale. Macro headwinds won’t linger forever and great companies use these volatile periods to enhance the underlying business so when the normalization phase arrives, the stocks look a lot cheaper when the earnings surprises start rolling in. This is the future we see for most leading consumer brands today. Great businesses don’t lag indefinitely; the positive catalyst is straight ahead.

Disclosure: The above data is for illustrative purposes only. This information was produced by Accuvest and the opinions expressed are those of the author as of the date of writing and are subject to change. Any research is based on the author’s proprietary research and analysis of global markets and investing. The information and/or analysis presented have been compiled or arrived at from sources believed to be reliable, however the author does not make any representation as their accuracy or completeness and does not accept liability for any loss arising from the use hereof. Some internally generated information may be considered theoretical in nature and is subject to inherent limitations associated therein. There are no material changes to the conditions, objectives or investment strategies of the model portfolios for the period portrayed. Any sectors or allocations referenced may or may not be represented in portfolios managed by the author, and do not represent all of the securities purchased, sold or recommended for client accounts. The reader should not assume that any investments in sectors and markets identified or described were or will be profitable. Investing entails risks, including possible loss of principal. The use of tools cannot guarantee performance. The charts

depicted within this presentation are for illustrative purposes only and are not indicative of future performance. Past performance is no guarantee of future results.

Where are the Hidden Risks in Your Portfolio Currently? Plus, An Idea

Key Summary:

  • Investors have much more tech exposure than they realize.

  • Adding exposure to strategies that look very different than the indexes adds value.

  • When sentiment is dreadful, and the earnings data is stable, opportunities exist.

Very Important thesis: If equities generate roughly 8-10% a year over time, leading brands serving the dominant driver of the economy, in theory, should compound at 10-15%+ over time. We have significant proof on this topic. In a world where rates and inflation are higher than we might like, business models with pricing power, exposure to quality factors, and that generate strong profits and free cash are set up to win versus the typical peer. Brands Matter.

Adding dedicated consumer exposure has never been more compelling in our view.

Allocators add new exposures for a variety of reasons; diversification, returns, risk mitigation, etc. Understanding this, what is the most over-owned and expensive sector today? Technology, by a country mile. Generally, exposures here have been a net positive for total returns which means most have become a bit complacent about exposure levels. As the market often does, it drives themes and narratives to extremes. It’s at the extremes when much more volatile outcomes can happen. That’s where I think we are in technology broadly today. As I’ve stated before, the largest allocation in most investor portfolios are stocks that generally fall into the large blend and large growth style boxes. Understanding how these two indices are allocated is vital to the risk management of client portfolios given the size of the allocation for the average investor. The S&P 500 is the benchmark for the S&P 500 and the Russell 1000 Growth for the large growth style box.

Here’s how passive and most active funds are positioned given their benchmarks: Currently, 49% of the large growth benchmark is technology. But it doesn’t stop there, another 12% is allocated to Communications Services, which is another proxy for technology companies. So, the R1G is 61% “tech”, plus a few tech-focused Consumer Discretionary stocks at a roughly 8.5% weighting, bringing the real total of tech to about 70%. Turning our attention to the S&P 500 Index, the tech weighting here is 31.5% plus another 8.8% in Communication Services, plus another roughly 5% in Consumer Discretionary, tech-related companies. This brings the total to about 45% in tech exposure. That’s a lot of tech and a lot of double exposure to the same stocks in the largest part of most portfolios. The good news: many of the mega cap tech brands are high quality and have extraordinary moats around their businesses. Unfortunately, most are outright expensive at this point. BTW, this exposure data doesn’t include the heavy weights to tech at the mid-cap, small-cap and international growth and blend levels. The average investor now has massive tech exposure. Just something to ponder as an allocator and Fiduciary.

Perhaps adding exposure to strategies that look very different to these heavy tech exposures is warranted with tech valuations near all-time highs? Perhaps there are other thematics and exposures that warrant attention? Maybe something that’s logical, defendable, radically under-owned, out of favor, and historically has performed well over time? The average consumer stock certainly fits this description.

The Case for Adding Dedication to the Consumer.

It’s always been our view that the most defendable core equity allocation should be directly tied to the core driver of the economy in which we invest. In the U.S. and around the world, household spending drives everything. Globally, the theme is a $50 trillion annual opportunity for investors. The major disconnect: very few investors have any dedication or meaningful exposure to the largest phenomenon on the planet. That’s why we created the Brands strategy in 2016.

Consumer stocks are incredibly under-owned today. Here’s some proof: Simply adding up all the assets in ETF’s with over $100M in AUM shows the total assets in Tech ETF’s alone at $255.1 billion. Contrast that to the Consumer Discretionary sector at $28.8B and Consumer Staples also at $28.2B. Plus, another $10B in consumer-related mutual fund assets. The data is very clear, EVERYONE is under-weight the consumer. So collectively, there’s 10x more assets in Tech ETF’s & funds versus Consumer-dedicated investment products even though the total value of the discretionary and staples stocks is well over $17.7 trillion. I assure you if we ever had another 2000-2003 tech wreck or a style shift away from tech, the attorneys would be asking allocators if they knew how much exposure they had to tech and tech related stocks. The answer generally would be, “I had no idea.”

Consumer Stocks: A Recent Earnings Season Summary

The narrative in the media is, “the consumer is tapped out.” As someone who spends 100% of his time analyzing consumer habits, spending trends, and consumer balance sheets, I can say the truth is much more nuanced than this catchy headline. A few weeks ago, I wrote a note asking if the consumer was tapped out or just “opting out” of broad purchases. There’s a big difference here. Consumers are voting with their wallets and telling brands across all categories, “get your prices back in-line or we will defer our spending.”  I’m hearing the responses from brands in this earnings season. They have gotten the message, are working on bringing down prices, and heavily focused on bringing internal costs down to combat the mean reversion in margins. Some brands have the luxury and ability to beat EPS even when they are lowering prices, others do not. That’s where stock selection comes in. Additionally, we are still seeing a consolidation of shopping visits that began in the pandemic. There are clear winners and losers today as consumers continue the habits, they formed in 2020-2021. I have not seen this bifurcated a consumer spending market in my 30 years analyzing the industry.

This earnings season highlights how stable the consumer sector is, even if the stocks can be volatile on occasion. In the graph below, I show the summary of the Consumer Discretionary sector across industries via the avg sales and EPS results versus expectations.

Like many other sectors, the sales line was generally in-line without a ton of growth, but the EPS surprises are where the opportunities are showing up. Interestingly, the service names are finally seeing slower trends after 2 years of above average growth while the goods sector begins to normalize higher. Remember, most earnings revisions down were from the goods sector and this quarter hints we have likely seen a trough in downside revisions.

Consumer Discretionary

Source: Bloomberg

E-Commerce Within Consumer Discretionary – It’s an Amazon world.

Amazon is the 800lb gorilla in the fastest growing portion of retail, e-commerce. Amazon is one of the most recognized and relevant brands in the world and it’s by far, the cheapest of the Mag7 stocks. With a slow and steady growth profile for the core retail business and more margin expansion on the horizon, plus the faster growth businesses of advertising, subscriptions, and AWS Cloud and AI, the sum of the parts valuation today shows Amazon to be about 35%+ undervalued. Below is a Bloomberg snapshot of the recent earnings results for AMZN. When you get strong EPS (+23% surprise vs street estimates), which includes superior “cost to serve” datapoints, over time you generate significant free cash flow with the opportunity to reinvest this cash for high rates of return. That’s why they call these stocks “compounders.”

Source: Bloomberg

Consumer Staples

Consumer Staples tend to lag in up markets and play catch-up in tougher environments. With growth downshifting, I’m not surprised to see money flow towards more defensive sectors like Staples. Generally, most of these great brands have little to no sales growth and high valuations. In short periods of time, market participants don’t care, they just focus on the defensive qualities of the stocks. A look below at the sales and EPS results highlights very little growth but decent beats on the EPS line again. You see the trend here? Companies across most sectors are focusing on being operationally fit and driving cost efficiencies that create EPS beats. Implementing AI initiatives will further drive these EPS beats, but it will take time.


Disclosure:
This information was produced by, and the opinions expressed are those of Accuvest as of the date of writing and are subject to change. Any research is based on Accuvest proprietary research and analysis of global markets and investing. The information and/or analysis presented have been compiled or arrived at from sources believed to be reliable, however Accuvest does not make any representation as their accuracy or completeness and does not accept liability for any loss arising from the use hereof.  Some internally generated information may be considered theoretical in nature and is subject to inherent limitations associated therein.   Any sectors or allocations referenced may or may not be represented in portfolios of clients of Accuvest, and do not represent all of the securities purchased, sold, or recommended for client accounts.

The reader should not assume that any investments in sectors and markets identified or described were or will be profitable. Investing entails risks, including possible loss of principal. The use of tools cannot guarantee performance. The charts depicted within this presentation are for illustrative purposes only and are not indicative of future performance. Past performance is no guarantee of future results. Actual results may vary based on an investor’s investment objectives and portfolio holdings. Investors may need to seek guidance from their legal and/or tax advisor before investing. The information provided may contain projections or other forward-looking statements regarding future events, targets, or expectations, and is only current as of the date indicated. There is no assurance that such events or targets will be achieved, and they may be significantly different than those shown here. The information presented, including statements concerning financial market trends, is based on current market conditions, which will fluctuate and may be superseded by subsequent market events or for other reasons.

Consumer Spending: Are Consumers Tapped Out or Pushing Back?

Key Summary:

  • Sentiment towards the consumer and spending is about as negative as I’ve seen.

  • Assets and allocations to consumer-related stocks haven’t been this low ever.

  • Are consumers tapped out or just fed up with high prices and sending brands a message?

Very Important thesis: If equities generate roughly 8-10% a year over time, leading brands serving the dominant driver of the economy, in theory, should compound at 10-15%+ over time. We have significant proof on this topic. In a world where rates and inflation are higher than we might like, business models with pricing power, exposure to quality factors, and that generate strong profits and free cash are set up to win versus the typical peer. Brands Matter.

Forecasts for Consumer Spending are Wide Enough to Drive a Truck Through.

I hope you are having a great summer! I was driving back from Lake Tahoe and listening to a popular financial media channel that was interviewing two “experts” on the health of the consumer and consumer spending trends. Both guests were clearly smart, well prepared, highly educated, and with multi-decades of experience. With all the same training and data, somehow these guests’ view about the consumer were diametrically opposed to each other. I think this interview sums up how the world feels about the consumer and therefore consumer stocks. Confused. So, let’s dig-in and try and make some sense of what’s happening in consumer-land.

I have been saying all year, the consumer will likely not be spending broadly and will be stingy about where and what she spends on. That will influence consumer stocks, and we should expect bifurcated performance in the sector. FYI, YTD, the Consumer Discretionary sector is the worst performing sector this year, which is very rare. When a sector tends to outperform often, the best opportunities often appear in the year when performance is sub-par. Not surprisingly, we are about as bullish as we have ever been on this sector as earnings revisions get to trough levels and much easier comparisons become the norm for the next 12 months.

Case in point: Nike is off 57% from its November 2021 highs. Lululemon is off 53% from its December 2023 highs. Disney is off 57% from its highs. Dollar General is off 54% from the highs seen in late 2022. The pandemic, the supply chain disruptions, 50-year high inflation, rapidly rising interest rates and the negative consumer sentiment affect have all conspired to create a difficult environment for the average consumer stock. But that is the past my friends.

Very Few Investors Have Any Real Exposure to Consumer Stocks.

Whether we like it or not, money flows follow recent performance, so the consumer sectors have been all but abandoned by investors and momentum traders. There’s a ton of diamonds in the dumpster today folks. In my last note, I talked about the most crowded trades and the likelihood they could introduce a lot of angst into investors lives as they unwound. With the help of the Yen carry-trade unwind as the catalyst, many of the most crowded trades became much more volatile than people thought possible. The knee-jerk reaction was to sell everything, but we know that’s always the wrong response. Since last Monday, markets have stabilized, and some fear has crept back into a complacent market. Overall, that’s a very good thing as investors and traders lean back on their heels again.

To highlight how little exposure the world has to consumer stocks today, I have added the excerpt from my last note showing asset levels across sectors. “Looking at the sector ETF’s with >$1B of assets, there’s roughly, $247B in total Technology assets versus about $27B in Consumer Discretionary assets and about $24B in Consumer Staples assets. So tech now accounts for over 9x more assets than Consumer Discretionary yet household consumption accounts for 70% of GDP…When I say, “the consumer sectors are under-owned and unloved”, I mean it’s at extremes I have NEVER seen.”

Source: Accuvest

The Punchline: Consumers are NOT Tapped Out, They are Opting-Out.

I have not heard one consumer expert talk about the possibility that consumers are simply sending a message to companies that the prices are too high and they will return when they normalize. Not being willing to spend on an item is much different than not having the capability to spend. Yes, the lowest income cohorts, who always live paycheck to paycheck, have really had a hard time with 2 years of high inflation and higher rates. But the other 2/3 of the economy are employed, have stable to rising incomes, and have spending capacity. Do you think the consumer economy is really hurting when higher priced fast casual brands like Chipotle and Shake Shack are reporting solid results and traffic numbers? Or when the demand for Live Events like concerts remains robust? Or when consumers are willing to pay $28 for the $15 burrito to have it delivered by Uber Eats or Door Dash? Or when they choose to take the frequent, and expensive Uber rides? Consumers are spending situationally and with intent. That’s very different than being in turmoil.

There is very little evidence that broadly, consumers are in trouble. The data we have across every important consumer spending category continues to scream: the consumer is making choices because they are fed-up with higher prices and have started pushing back, and voting NO on items that are egregiously over-priced. This means there is a wall of consumer spending just waiting for prices to normalize, which we have already started to see in certain categories like grocery, warehouse shopping, chain restaurants, airlines, etc. Some industries and companies are more challenged with the ability to cut prices than others. This will continue to affect our stock selection and how much broad exposure we add over the next 6 months. In many cases, margins could fall further as companies choose to sacrifice margins for more traffic.

THE UPSIDE:

There’s already been significant damage to much of the consumer stock universe. The market is a discounting mechanism, it’s already well on its way to discounting extreme outcomes and some of the best brands, in the most important spending categories are now trading at some of the most attractive levels we have seen in 2 decades. I suspect some of the recent selling is early tax-loss harvesting and will reverse later this year but the question every opportunist should be asking today:

“WHICH MEGA BRANDS ON SALE DO I NEED TO START BUYING?”

Disclosure:
This information was produced by, and the opinions expressed are those of Accuvest as of the date of writing and are subject to change. Any research is based on Accuvest proprietary research and analysis of global markets and investing. The information and/or analysis presented have been compiled or arrived at from sources believed to be reliable, however Accuvest does not make any representation as their accuracy or completeness and does not accept liability for any loss arising from the use hereof.  Some internally generated information may be considered theoretical in nature and is subject to inherent limitations associated therein.   Any sectors or allocations referenced may or may not be represented in portfolios of clients of Accuvest, and do not represent all of the securities purchased, sold, or recommended for client accounts.

The reader should not assume that any investments in sectors and markets identified or described were or will be profitable. Investing entails risks, including possible loss of principal. The use of tools cannot guarantee performance. The charts depicted within this presentation are for illustrative purposes only and are not indicative of future performance. Past performance is no guarantee of future results. Actual results may vary based on an investor’s investment objectives and portfolio holdings. Investors may need to seek guidance from their legal and/or tax advisor before investing. The information provided may contain projections or other forward-looking statements regarding future events, targets, or expectations, and is only current as of the date indicated. There is no assurance that such events or targets will be achieved, and they may be significantly different than those shown here. The information presented, including statements concerning financial market trends, is based on current market conditions, which will fluctuate and may be superseded by subsequent market events or for other reasons.

The Consumer and Consumer Spending Continues to be Stable & Positive

Key Summary:

  • Consumer spending has mean reverted to normal ranges after the pandemic excesses.

  • When leaders lag for a trailing 3-year period, a mean reversion opportunity is presented.

  • Retail Sales can be volatile, but the trend is up and to the right. Consumers love to spend.

Very Important thesis: If equities generate roughly 8-10% a year over time, leading brands serving the dominant driver of the economy, in theory, should compound at 13%+ over time. We have significant proof on this topic below. For a variety of reasons, the last few years has been difficult for the average stock. Betting against consumption-focused stocks after a below-average 3 years has been a poor investment decision. History is very clear on this topic.

U.S. Retail Sales: Up and to the Right the Vast Majority of the Time.

Source: Bloomberg

Like most economic data, the monthly data series can often be volatile and noisy, yet very few datapoints are worthy of making portfolio shifts. Avoid the noise, focus on the long-term, linear trend.

For household spending and the important Retail Sales data, the trend has been your friend for many decades. Should that surprise anyone given it’s roughly 70% of the economy and such an enormous datapoint worth about $6 trillion per year.  My question is always, “do you think $6T in retail sales and/or $15T in total household spending is large enough to warrant dedication in your portfolio?” We certainly believe it is, and the opportunity is enormous for investors because very few have any dedication to a group of high-quality consumer brands. This allocation remains THE most commonsense but under-allocated theme in a portfolio.

Let’s look at some of the categories from today’s Retail Sales report for February. Again, there’s not a ton to extrapolate out of one month of data but our team likes to look at the inner workings of consumer spending to see what industries to avoid or embrace in portfolios. Total U.S. Retail Sales ex-food, autos, and gas saw a slight acceleration from January. E-commerce saw a slight downtick month/month, while most other categories either got better and stayed positive or were slightly better than January while still being negative. Remember, Retail Sales data was trending well above the linear long-term average because of excess savings and stimulus payments so we are well on our way to mean reverting back towards the long-term trend. There were so many distortions created by the Pandemic and the responses to it, is there any wonder the average consumer stock has experienced a rare sub-par 3 year return relative to the typical outperformance they have tended to generate long-term?  Just remember, generally when an outperforming theme turns in a rare underperformance period, the opportunities on a go forward basis tend to be robust assuming nothing has changed with the theme. Consumer spending is about as predictable as it gets, so we see blue skies for the leading brands operating in important spending categories here and abroad.

Retail Sales Could Accelerate Going Forward but Will Remain Stable in 2024.

Generally, the comparisons get easier from here as well. For perspective, the YOY change in total Retail Sales ending February 2023 was +6%, this has mean reverted to more normal levels at +1.6%. We have tax refunds coming so that should also give a boost to consumer spending as consumers save and spend some of any refunds they get. Then we have the summer travel season and all the things we purchase for vacations. E-commerce slowed a bit, month over month but is still solid at 6% YOY. Amazon is still printing money as the leader here. Sporting goods, toys, & hobbies are easing off the tough comparisons but stabilizing. Electronics, one of the categories hit particularly hard last year have begun to stabilize and are generally back in positive YOY territory. Furniture remains a tough category, although you would never know it when listening to Williams Sonoma’s recent earnings report. Some businesses just resonate more with consumers and the stock acts in kind. Comps for the category about as bad as we think they will get; we are just not sure they will recover in V-fashion. The general merchandise category remains very stable. Think Walmart, Target, Costco here. These companies are doing just fine today even while dealing with theft and margin pressures. The clothing & accessory stores are generally trending fine, no big moves in either direction given the category is somewhat of a necessity. We do think the consumer spending here is somewhat bifurcated between higher priced, differentiated goods and low-priced, trade down activity at discount stores. Consumers are still interested in high quality, differentiated experiences and services while being very specific about their goods consumption. Trade-down activity and saving money are still a priority. Generally, that’s how the portfolio is allocated today.


Disclosure:
This information was produced by, and the opinions expressed are those of Accuvest as of the date of writing and are subject to change. Any research is based on Accuvest proprietary research and analysis of global markets and investing. The information and/or analysis presented have been compiled or arrived at from sources believed to be reliable, however Accuvest does not make any representation as their accuracy or completeness and does not accept liability for any loss arising from the use hereof.  Some internally generated information may be considered theoretical in nature and is subject to inherent limitations associated therein.   Any sectors or allocations referenced may or may not be represented in portfolios of clients of Accuvest, and do not represent all of the securities purchased, sold, or recommended for client accounts.

The reader should not assume that any investments in sectors and markets identified or described were or will be profitable. Investing entails risks, including possible loss of principal. The use of tools cannot guarantee performance. The charts depicted within this presentation are for illustrative purposes only and are not indicative of future performance. Past performance is no guarantee of future results. Actual results may vary based on an investor’s investment objectives and portfolio holdings. Investors may need to seek guidance from their legal and/or tax advisor before investing. The information provided may contain projections or other forward-looking statements regarding future events, targets, or expectations, and is only current as of the date indicated. There is no assurance that such events or targets will be achieved, and they may be significantly different than those shown here. The information presented, including statements concerning financial market trends, is based on current market conditions, which will fluctuate and may be superseded by subsequent market events or for other reasons.

Accuvest Welcomes James Calhoun as the New President and Chief Investment Officer

Provo, Utah — Accuvest Global Advisors (Accuvest) a leading investment advisory, is excited to announce the appointment of James Calhoun as the new President and Chief Investment Officer, effective January 5th, 2024.

With a decade-long tenure as a Portfolio Manager at Accuvest, James possesses extensive experience and a demonstrated track record in managing global multi-asset portfolios.

"We are delighted to welcome James in his new role. His passion for investment management, deep understanding of our industry and strategic vision align perfectly with our company's goals and values.  His expertise and leadership will be key to helping us take Accuvest to the next level," said David Garff, Accuvest's CEO.

Expressing enthusiasm about his new position and the opportunities ahead, James stated, "I am honored to be part of Accuvest, a company known for its integrity, innovation, and global focus. I look forward to contributing to the continued success and growth of the organization."

Before joining Accuvest, James served as a portfolio manager and senior research analyst for a multi-alternative strategy mutual fund. Holding Bachelor of Science degrees in Finance and Economics from the University of Nevada, Reno, James is a Chartered Financial Analyst (CFA) and holds a NASAA Series 65 License.

For media inquiries, please contact:


Accuvest Marketing

Marketing@accuvest.com

925-930-2882


About Accuvest Global Advisors:

Accuvest Global Advisors is a SEC registered investment advisor that works with a global client base to help them navigate increasingly complex global markets.  Institutions, financial advisors and wealthy families have used Accuvest’s innovative, global investment strategies to meet their investment objectives for almost 20 years.  Accuvest’s strategies range from multi-asset portfolios to equity portfolios in our Country First® and Alpha Brands® product suites.

Monitoring Extremes in Retail Investor Sentiment Offers a Wonderful Edge

Key Summary:

  • History shows, the average investor gets bearish at precisely the wrong time.

  • Exceptionally strong 1-month returns tend to hint at better returns ahead.

  • Consumer Sentiment improvements could be a hidden bullish opportunity for stocks.

Important thesis: If equities generate roughly 8-10% a year over time, the leaders of industry should, in theory, compound at 13%+ over time. We have significant proof on this topic where top brands are concerned. Due to the pandemic, rapidly rising inflation and an interest rate normalization phase, the last few years has been difficult for the average stock. As the normalization process continues, investors are getting some wonderful buying opportunities today, particularly in quality, smaller companies.

Being a Contrarian Has Often Generated Strong Returns:

There are many ways to track consumer and investor sentiment. Generally, only at extremes does the data offer very compelling investment opportunities. Towards the end of October, sentiment across markets was dreadful. The equity markets experienced a decent pullback and retail investor sentiment, as measured by the AAII Survey, reached a bearish extreme. Just as everyone was leaning bearish and expecting the next down move, the calendar turned, and stocks ripped higher in November, leaving many investors flat-footed and under exposed. My channel checks showed little interest in adding to stocks, as they have most of the year, and the news flow was skewed negative. It’s important to note; negative narratives always sound so provocative, they are always present, and yet markets rise about 80% of the time. Is there any wonder why the average investor fails to generate the returns they should over time?

To illustrate the disconnect between equity prices and retail investor sentiment, below is a chart showing bullish and bearish reading from the AAII Investor Survey. The track record of fading bearish extremes remains impressive. The stock market is +30%+ since the peak of bearish readings. Buying great merchandise on sale has generally been a very wise decision.

Extremely Poor Stock Breadth + Peak Bearishness Positioning Tends to Lead to Gains

The chart below from market technician, Ryan Detrick from the Carson Group highlights past instances when an outsized month occurred since 1950. In a recent Tweet, he notes: “last month (November), was the 18th best monthly gain for the S&P 500 since 1950. Looking at previous top 20 monthly returns shows ABOVE average returns going forward. A year later, the market was +13.3% on average and higher 80% of the time.” The chart notes, the average return from 1950 to 2022 was +8.9% so his work hints at 2024 being a better than “average” year. No one knows the future and there are certainly plenty of macro, political, geopolitical, and economic events that could set an overbought market back, but when the average stock has still gone nowhere for two years, the odds favor a better, more broadly participating market in 2024 for stocks. Just remember, stocks can be volatile over short periods but please do not lose sight of the big picture.

Overall Consumer Sentiment Remains Low. There’s a Ton of Room for Improvement.

In markets, it’s the rate of change of things that’s often most important. Over the last few years, consumers have generally remained quite cautious and/or outright negative.  If there’s one factor that has the opportunity to make an outsized move back to “normal ranges”, it’s consumer sentiment. Being forced to spend more on virtually everything tends to lead to being in a foul mood, but many items are in the process of mean reverting to normal. As savings begin to build up again and prices gradually normalize, consumer sentiment should begin to trend back towards normal. The move from negative to normal should translate into sustained consumer spending and help consumer-focused stocks, and the overall market, get back to their winning ways.


 This information was produced by Accuvest and the opinions expressed are those of the author as of the date of writing and are subject to change. Any research is based on the author’s proprietary research and analysis of global markets and investing. The information and/or analysis presented have been compiled or arrived at from sources believed to be reliable, however the author does not make any representation as their accuracy or completeness and does not accept liability for any loss arising from the use hereof. Some internally generated information may be considered theoretical in nature and is subject to inherent limitations associated therein. There are no material changes to the conditions, objectives or investment strategies of the model portfolios for the period portrayed. Any sectors or allocations referenced may or may not be represented in portfolios managed by the author, and do not represent all of the securities purchased, sold or recommended for client accounts.  The reader should not assume that any investments in sectors and markets identified or described were or will be profitable. Investing entails risks, including possible loss of principal. The use of tools cannot guarantee performance. The charts depicted within this presentation are for illustrative purposes only and are not indicative of future performance. Past performance is no guarantee of future results.

A Five-Minute Consumer Trends Update

5 Minutes, 3 Topics, Consumer Focused.

Going forward, these market notes will focus on 3 items of interest with a bullet-point focus.

Key Summary:

  • Current market views.

  • Important earnings reports & important company news.

  • State of the consumer.

Important thesis: if the S&P 500 Index has generated an annualized return of roughly 8-10% over the long-term, leading companies serving important industries should, in theory, generate 300bps+ more over long periods of time. That’s what history has shown. Understanding this and investing for it offers investors a long-term edge. Importantly, underperforming years tend to be great buying opportunities so being a contrarian also offers an edge. Brands matter because consumer behavior is largely driven by brand loyalty. The higher the loyalty, the better the business. The better the business, generally the better the stock.

Current Market Views:

  • The easy part of the “inflation is falling” story is likely over.

  • Inflation should stay elevated as wages, energy, and shelter stays elevated.

  • Food inflation could also stay elevated for longer.

  • No one should be surprised if the Fed holds its hawkish tone.

  • Markets could be more volatile around key economic data releases going forward.

  • Volatility has always offered opportunists better entry prices.

  • Not every company is thriving today, so stock selection and concentration likely wins.

  • High quality balance sheets, pricing power, margin stability, market leaders, should be favored until valuations in 2nd tier stocks get too attractive to ignore.

Earnings Reports & Corporate News that Impressed Us:

  • Lululemon (LULU):

    • Strong sales and margin trends.

    • Exceptional international growth opportunities.

    • China rebounded strongly.

    • Asia is an enormous and under-appreciated opportunity.

    • Athleisure apparel and footwear is one of the most stable consumption tends.

  • Visa (V):

    • Global spending trends have been much more stable than the street expected.

    • Higher average transaction size appears to be the norm (inflation).

    • Cross-border travel and e-commerce also remain stable.

    • Enormous global opportunity in new businesses like peer2peer volume.

    • Significant opportunities in emerging markets through “unbanked” consumers.

  • Blackstone (BX):

    • BX will be added to the S&P 500 later this month.

    • A testament to its dominance in the alternative industry.

    • An estimated $15 billion of incremental buying from passive buyers will occur.

    • This amount accounts for roughly 19% of the company’s free float.

    • The 3% current dividend should grow by an estimated 50% over the next 3 years.

State of the Consumer:

  • We continue to expect “trade down” behavior from consumers who are struggling.

  • We continue to expect “selective indulgences” to be favored over broad discretionary spending items.

  • These trends will impact corporate earnings and stock performance.

  • Lower income consumers are feeling the inflation pinch most.

  • Traditional recession-resistant “defensives” (bond proxies) have not performed well.

  • A large portion of consumer defensives are still expensive with poor growth profiles.

  • Theft across retail should continue to be pose a problem for sentiment and companies.

  • Credit card use and delinquencies have risen but are still low relative to history.

  • Consumers are favoring the important “needs” & “loves” and deferring many non-necessary spending.

  • In the consumer goods sector, discounts are back, which should keep retail sales elevated and offer attractive holiday shopping bargains.

  • In the services sector, prices remain high, and we expect consumers to be more price conscious going forward.

  • Bottom line: we are being very selective about which brands and spending categories to participate in.

 This information was produced by Accuvest and the opinions expressed are those of the author as of the date of writing and are subject to change. Any research is based on the author’s proprietary research and analysis of global markets and investing. The information and/or analysis presented have been compiled or arrived at from sources believed to be reliable, however the author does not make any representation as their accuracy or completeness and does not accept liability for any loss arising from the use hereof. Some internally generated information may be considered theoretical in nature and is subject to inherent limitations associated therein. There are no material changes to the conditions, objectives or investment strategies of the model portfolios for the period portrayed. Any sectors or allocations referenced may or may not be represented in portfolios managed by the author, and do not represent all of the securities purchased, sold or recommended for client accounts.  The reader should not assume that any investments in sectors and markets identified or described were or will be profitable. Investing entails risks, including possible loss of principal. The use of tools cannot guarantee performance. The charts depicted within this presentation are for illustrative purposes only and are not indicative of future performance. Past performance is no guarantee of future results.

Core Brands Receives PSN Top Guns Distinction

Accuvest Global Advisors has again been awarded a PSN Top Guns distinction by Informa Financial Intelligence’s PSN manager database, North America’s longest running database of investment managers.

 Accuvest’s AlphaBrands Core Equity Strategy was honored with 2 stars in the Large Cap Core Equity Universe which translates to the strategy being a top performer over the trailing 1-year period. This is particularly noteworthy given the difficult equity markets over the last 1 year. A testament to the multi-pronged approach to investing in leading global brands. Alpha Brands Core equity strategy utilizes a multi-factor approach and selects a focused portfolio of brands across three important style factors: strong growth and margins (Operating Kings), high dividend and FCF yields (Sustainable Yielders), and price momentum leaders.

“Receiving the two-star designation from PSN is yet another proof-point that top global brands can be attractive investments, even in difficult economic and macro environments. In a world where inflation and rates should stay a bit higher for longer, pricing power and free cash flow generation are paramount…this is an ideal set-up for leading brands” says Dave Garff, CIO of Accuvest.  “Consumption is a $40+ trillion annual market which makes the thematic the ideal core equity choice, and brand relevancy drives our consumption habits” says lead Portfolio Manager, Eric Clark.

For Advisors who utilize Separately Managed Accounts and/or model delivered SMA’s, the Core Brands strategy is available across a variety of top SMA platforms. For those who prefer active mutual funds, our team sub-advises a fund through Catalyst Funds called Dynamic Brands, HSUTX. Both strategies invest in iconic and highly relevant brands around the globe. Many of these brands are the household names we spend our time and money on each year. Brands Matter.

Through a combination of Informa Financial Intelligence’s proprietary performance screens, PSN Top Guns ranks products in six proprietary categories in over 50 universes. This is a well-respected quarterly ranking and is widely used by institutional asset managers and investors.

Top Guns 2 Stars:

Accuvest’s strategy was named Top Gun for the U.S. Large Cap Core Universe, meaning the strategy was a top performer over the trailing 1-year period. Moreover, the strategy’s returns exceeded the S&P 500 benchmark for the one year, three years, and since 9/2016 inception periods as of 7/31/2023.

About Informa Financial Intelligence’s Zephyr:
Financial Intelligence, part of the Informa Intelligence Division of Informa plc, is a leading provider of products and services helping financial institutions around the world cut through the noise and take decisive action. Informa Financial Intelligence's solutions provide unparalleled insight into market opportunity, competitive performance and customer segment behavioral patterns and performance through specialized industry research, intelligence, and insight. IFI’s Zephyr portfolio supports asset allocation, investment analysis, portfolio construction, and client communications that combine to help advisors and portfolio managers retain and grow client relationships. For more information about IFI, visit https://financialintelligence.informa.com. For more information about Zephyr’s PSN Separately Managed Accounts data, visit https://financialintelligence.informa.com/products-and-services/data-analysis-and-tools/psn-sma.

Top Gun rating definition: Top Gun Rating System


Disclosure:
This information was produced by Accuvest and the opinions expressed are those of the author as of the date of writing and are subject to change. Any research is based on the author’s proprietary research and analysis of global markets and investing. The information and/or analysis presented have been compiled or arrived at from sources believed to be reliable, however the author does not make any representation as their accuracy or completeness and does not accept liability for any loss arising from the use hereof. Some internally generated information may be considered theoretical in nature and is subject to inherent limitations associated therein. There are no material changes to the conditions, objectives or investment strategies of the model portfolios for the period portrayed. Any sectors or allocations referenced may or may not be represented in portfolios managed by the author, and do not represent all of the securities purchased, sold or recommended for client accounts.  The reader should not assume that any investments in sectors and markets identified or described were or will be profitable. Investing entails risks, including possible loss of principal. The use of tools cannot guarantee performance. The charts depicted within this presentation are for illustrative purposes only and are not indicative of future performance. Past performance is no guarantee of future results.

A Consumer Health Update

Household spending drives the economy. Monitoring the consumer is vital for investors.

Key Summary

  • Consumer sentiment is enormously important for markets and it’s still quite low.

  • Consumer spending is still strong while being lumpy across spending categories.

  • Incomes and job security are high while some cohorts are showing signs of fatigue

Important thesis: if the S&P 500 Index has generated an annualized return of roughly 8-10% over the long-term, leading companies serving important industries should, in theory, generate 300bps+ more over long periods of time. That’s what history has shown. Understanding this and investing for it offers investors a long-term edge. Importantly, underperforming years tend to be great buying opportunities so being a contrarian also offers an edge. Brands matter because consumer behavior is largely driven by brand loyalty. The higher the loyalty, the better the business. The better the business, generally the better the stock.

Consumer Sentiment Update:

The longer the prices of everything we consume regularly stay elevated; the more discerning consumers will be regarding spending. Not every spending category is thriving currently because consumers are making choices about where to spend. Trade-down behavior is widespread and saving money is a key goal. Selective indulgences are also widespread because there are certain activities and products, we simply love too much to ignore. Here, consumers are willing to spend a bit more because the activity/product is important, and the brand has high brand appeal. The brands and spending categories that fall into these categories are performing much better than the aggregate retail-focused company. Market share and loyalty matter more than ever today. Now is a time for the leaders to widen the delta between them and the peer group.

The following charts from Goldman Sachs Research shows a variety of consumer health metrics. Let’s start with consumer sentiment. It’s still quite low by historical standards. The right pane below, shows sentiment by income bracket. The top 33% feels a bit better than the rest, but generally, consumers are still concerned about high prices. They may be concerned, but looking at the recent retail sales numbers shows their concern, generally, hasn’t affected their actual spending yet. The upside from low sentiment: there’s a significant amount of recovery that will eventually happen, and it has positive ramifications for earnings and deferred spending over time.

Consumer spending is still strong, despite the doom & gloom narrative.

The latest Retail Sales report highlighted the continued resilience of consumers and their spending. Again, spending is not broad-based and smooth, we are deferring non-essential spending to focus on “needs” and “high importance” items like staples and experiences. As the summer and vacation season ends, we expect consumers to focus on the deferred goods spending as prices have come down with incentives getting interesting. Overall, we expect consumer spending to continue to be more resilient than people expect. Additionally, with the prices of many items still elevated, the earnings of the best brands should stay elevated and on solid footing. It’s the second and third tier brands that should continue to experience earnings and revenue headwinds. Over the next quarter or two, estimates should come down enough for a positive beat cycle to begin. This remains a “step-up” opportunity across consumer stocks. As we see this occur, we intend to sift through the rubble to add exposure to a handful of the long-term winners in key spending categories. The Goldman chart below highlights goods spending is still elevated from long-term trendlines and services are slightly below. We expect services and “experiences” to remain of interest to consumers. With higher prices, labor costs and pressure on margins, selectivity in stocks continues to be vital.

Incomes & employment are still strong.

Corporate layoffs have risen slightly but off of a very low base. Generally, consumers do not quit jobs when they do not feel they can get a better, higher paying job. Corporate right-sizing should continue to be a key theme, however. Controlling costs and margins remains very important to company executives. If layoffs do accelerate, we could see more white-collar employees seeking work but for now, we do not see a real problem brewing.

Disposable incomes have risen, albeit not as fast as the early days of inflation ramping. With inflation trending down, higher incomes should help with consumer sentiment and spending. Importantly, the bottom income quintile has seen the best income growth. This is something we have not seen in a very long time. It’s this cohort of the population that’s most vulnerable to persistent high prices so their high job security and higher incomes should help the cohort weather this inflationary storm better than former periods.

Delinquencies across major lending categories are still generally low. These categories are important to monitor but generally, they are still flashing positive. Yes, credit card delinquencies have risen as high debt consumers have experienced a more difficult time servicing high interest debt, but the current levels are still better than the prior decades average. Because most housing debt is fixed and locked at low rates, mortgage delinquencies remain at all-time lows. The wealth effect of a recovering stock market and home price appreciation offers these consumers a bigger spending cushion via consumption capacity than ever before. Auto loan delinquencies have ticked up slightly, particularly for sub-prime borrowers, but generally they remain within historical levels. Student loans have been in the news lately and we should expect delinquencies to rise slightly after the moratorium ends but this will be a very slow-moving train and we do not expect a large jump in delinquencies. We do expect, however, some non-essential spending could be deferred and more trade-downs to occur as this payment begins to take away from discretionary spending.

Consumer revolving credit lines have risen lately as some cohorts struggle with paying bills but off a historically low base. The historic deleveraging that occurred after the financial crisis has changed the way consumers manage their balance sheet. That’s a very good development. Goldman expects this number to mean revert slightly higher and back to the recent trends, which is still well below the good-ole days of rampant spending by consumers.

Bottom Line:

High prices always change consumer behavior. Consumers are very good at being cost-conscious when the need arises. While incomes and job security are generally high, consumer sentiment is well below normal levels, and this offers a significant tailwind for spending once normalized. Inflation coming down will be a key catalyst. For now, we expect consumers to stay focused on saving money where they can and spending well on what they really love.


Disclosure:
This information was produced by Accuvest and the opinions expressed are those of the author as of the date of writing and are subject to change. Any research is based on the author’s proprietary research and analysis of global markets and investing. The information and/or analysis presented have been compiled or arrived at from sources believed to be reliable, however the author does not make any representation as their accuracy or completeness and does not accept liability for any loss arising from the use hereof. Some internally generated information may be considered theoretical in nature and is subject to inherent limitations associated therein. There are no material changes to the conditions, objectives or investment strategies of the model portfolios for the period portrayed. Any sectors or allocations referenced may or may not be represented in portfolios managed by the author, and do not represent all of the securities purchased, sold or recommended for client accounts.  The reader should not assume that any investments in sectors and markets identified or described were or will be profitable. Investing entails risks, including possible loss of principal. The use of tools cannot guarantee performance. The charts depicted within this presentation are for illustrative purposes only and are not indicative of future performance. Past performance is no guarantee of future results.