Lessons From Alternative Asset Managers – Private Equity & Real Assets: Where the Smart Money Invests

Key Points

  • The Private Equity industry has seen explosive AUM growth over the last 10 years.

  • Private Equity leaders have compounded client capital in strong & weak markets.

  • Private markets are more rational than public markets and offer a smoother ride.

“We are fortunate to be able to deploy a significant amount of dry powder with asset prices more dislocated and while capital is quite scarce”. KKR Management on the November 1, 2022 quarterly earnings call.

The Alternative Asset Management Business Has Grown Rapidly

A key mega trend our team is excited about is the migration of assets to alternative asset managers. Within the asset management industry, the alternatives category is growing fast and with significant room to expand. The “smart money,” which includes foundations, endowments, pensions, sovereign wealth funds, and insurance companies, have been investing in private markets for decades and between 20-40% of their total portfolios are still invested in this category today. The high-net-worth and private wealth markets have been much slower to adopt the private markets, but meaningful asset growth has begun while still being only roughly 2-4% of a typical HNW portfolio. Although they should, I do not expect the retail market to begin allocating like the smartest institutions. However, from where we sit today, there is still meaningful growth ahead in this channel. A recent Evercore ISI report shows each incremental 1% allocation from the wealth management platforms would mean $100 billion of additional assets to alternative managers. That’s powerful stuff.

Total funds under management across private markets reached an all-time high of over $10 trillion. Remember, the global equity market is about $111 trillion and the global fixed income market is about $127 trillion. So, the private markets are still a fraction of what the public markets are (data source: sifma.org). The trend is very clear, institutions have continued to increase allocations to private markets at the expense of public markets. Overall, the performance has been better, even with higher fees, the investment strategies are differentiated, and the ride is generally smoother. Here’s a chart from the largest PE firm, Blackstone, that I think will resonate with you. It shows various public and private asset class returns and volatility since 2017 when the Blackstone products were created for the HNW market. Winners are located in the northwest quadrant:

If you have any investments in Blackstone or KKR’s wealth management strategies, you’ve slept a lot better when comparing the daily volatility of equity and bond markets to private markets. The harsh reality is that the public markets have become more of a casino than they ever have. Algo’s and dark pools drive daily volume and short-termism. In addition, “trading” has become rampant. Private investors have the luxury of longer duration, far less volatility in business valuations, the confidence to average down when their investments have been marked lower, and a loathing for panic selling at bargain prices. That’s why private markets have become so important in a portfolio today.

Alternative Asset Managers Have Compounded Capital Strongly

Over the past 20 years, the Yale University Endowment has generated the top total return across all endowments tracked by Pensions & Investments. How did they do it? Smart asset allocation decisions, strong manager selection, and by avoiding short-termism. A key reason for the outperformance is the active decision to lessen their dependence on public securities in favor of adding a significant allocation to private securities. The chart below is a taste of what smart allocators in private markets have offered investors. This slide comes from KKR’s November 1, 2022 earnings presentation.

The best private equity firms simply have an information advantage and they see around corners because they own hundreds of companies and collect real-time data. They have a global opportunity set, the smartest professionals in the industry, and access to large amounts of capital to deploy at opportunistic times. Private Equity stocks are on sale today and the opportunities have never been more robust.

2022 has been a difficult year for public equities and fixed income. The 60/40 portfolio has never had such poor returns. Rates are normalizing after being manipulated by the Federal Reserve for over a decade. The demand for the services these Private Equity firms offer will only go higher.

To illustrate this more clearly, let’s connect a few dots.

  1. Do you think institutional money and retail investors will want more or less exposure to private market strategies that are holding up meaningfully better in a very tough year? More is the correct answer.

  2. With inflation set to stay elevated for longer and interest rates normalizing with a much higher cost of capital, do you think it gets harder or easier to generate attractive returns? Harder is the right answer. Remember, these PE firms saw this inflation three years ago and they positioned portfolio’s well in advance of rising prices.

  3. When the economy slows and markets act irrationally and drive asset values lower, do you think having significant capital ready to deploy at better prices ends with a positive outcome once the dust settles? Yes, is the correct answer.

FYI: Blackstone has $182 billion of dry powder waiting to be deployed. KKR has $113 billion.

Private Markets are More Rational than Public Markets

I’ll go out on a limb and say that sleeping soundly at night, particularly when markets are in turmoil, is something people can appreciate.

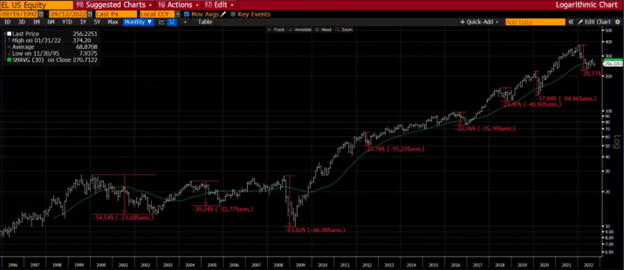
When we see the public markets gyrate with massive swings in both directions, one can only assume the second-by-second prices we see on screens are not always realistic. There are margin calls, forced selling for personal reasons, algo-driven parabolic moves, and mind-bending drawdowns. Actual businesses and their “values” simply do not fluctuate like the public markets indicate. To illustrate this, let’s see how Private Equity performed from peak 2007 into the Financial Crisis, how it recovered into 2011, and through the dotcom bubble and subsequent recovery. PE performed much better than their public market peers because they were not forced to sell, and they got more aggressive with buying assets at distressed prices. Sometimes, not seeing your assets priced every day is a very good idea. It is important to note that the stocks of PE firms struggle mightily because they are stocks in a stock market meltdown. However, their actual businesses & the opportunities they eventually capture generate significant forward returns. That’s what I expect for stocks going forward.

To quote a smart hedge fund manager I know, “the best alternative asset managers plant more seeds when things are scary and harvest more crops when things look great.”

Private Markets are More Rational than Public Markets

I know of no other flywheel that’s more robust or that holds better compounding opportunities than the Private Equity and Real Assets model. I’m not sure where markets will bottom, but I am quite confident in the ability of Blackstone and KKR to drive meaningful shareholder value in the future. Here’s the flywheel in a nutshell:

  • Top Private Equity firms employ the smartest investors in the world.

  • That offers these firms a major competitive advantage.

  • Which drives strong asset flows into the firm.

  • More assets drive more investments.

  • More investments drive more fee revenue and incentive fee revenue.

  • These firms have a history of strong returns for clients.

  • This drives even more new assets to the firm.

  • More assets drive more fee’s which leads to investors working with fewer firms.

  • More money going to fewer PE firms drives a widening competitive advantage.

  • Happier customers drive deeper relationships which drives even more asset flows.


Disclosure:
This information was produced by Accuvest and the opinions expressed are those of the author as of the date of writing and are subject to change. Any research is based on the author’s proprietary research and analysis of global markets and investing. The information and/or analysis presented have been compiled or arrived at from sources believed to be reliable, however the author does not make any representation as their accuracy or completeness and does not accept liability for any loss arising from the use hereof. Some internally generated information may be considered theoretical in nature and is subject to inherent limitations associated therein. There are no material changes to the conditions, objectives or investment strategies of the model portfolios for the period portrayed. Any sectors or allocations referenced may or may not be represented in portfolios managed by the author, and do not represent all of the securities purchased, sold or recommended for client accounts.  The reader should not assume that any investments in sectors and markets identified or described were or will be profitable. Investing entails risks, including possible loss of principal. The use of tools cannot guarantee performance. The charts depicted within this presentation are for illustrative purposes only and are not indicative of future performance. Past performance is no guarantee of future results.

Lessons From Peter Lynch: Invest In What You Know

Key Points

  • Peter Lynch is one of the most successful investors of all time. He ran the Fidelity Magellan Fund.

  • Fidelity Magellan was the best performing active fund in the industry under Lynch.

  • To generate outsized returns, Lynch advocated embracing volatility & staying invested.

“I’d rather invest in pantyhose versus communication satellites or hotel chains versus fiber optics”

” I love volatility…Take YUM Brands (Taco Bell)… I knew the company was in great shape and market volatility allowed me to buy more shares as it fell from $14 to $7 to $1 per share only to be acquired by Pepsi for $42 a few years later.

Here’s a quick three-minute link to an interview with Peter Lynch where he talks about market volatility: Peter Lynch: “I love volatility”

Peter Lynch…Invest in What you Know.

There are a handful of investors that have risen above everyone else over time. Peter Lynch was one of the titans of investing. Peter ran the Fidelity Magellan Fund from May 1977 to April 1990. Over that period, the Magellan Fund was the top performing equity fund. His “invest in what you know” approach is quite similar to what we preach with the top global brands approach to investing. Many things have changed in markets since Peter’s retirement in 1990, but nothing is more timeless than investing in companies you know, trust, and love and in the products and services you consume on a frequent basis. There’s a lot more research involved than just “investing in what you know”, but this ideal is a great first step in identifying potential strong investment opportunities. Peter preferred businesses that were easy to understand. He constantly stated that individual investors had an advantage over fund managers because they knew what brands were dominant in their local communities. It was like having insider information he used to say. He clearly believed in top brands given the holdings he had over his tenure, a testament to the fortitude of the thematic. He also clearly loved industry leaders as well as interesting turnaround situations. He preferred growth companies that could be bought for reasonable valuations and was keenly focused on important profitability metrics and competitive advantages. We whole-heartedly agree.

There are so many similarities between our approach and his that it’s uncanny. Brands matter as much today as they did when Peter was running Magellan. Brand relevancy changes over time but being the dominant brand in important spending categories tends to lead to very positive investment outcomes over time.

The Magellan Fund Under Peter Lynch’s Direction:

Wow, is all I can say. The Fund was the #1 performing equity fund during Peter’s management. Here’s a chart of the fund versus the S&P 500 over this 13-year period.

Source: Morningstar

Massive, annualized outperformance with similar volatility of returns when compared to the S&P 500. Perhaps there’s something to this “invest in what you know and understand” approach? I’ve looked at a number of holdings during his tenure and it reads like a who’s who of top brands of their time. It’s fun to look at these brands to see how relevant they are today or if they have become parts of other highly relevant brands. The great returns were generated through investing in some iconic brands like: Toys R Us, Taco Bell, La Quinta Resorts, Cracker Barrel, Home Depot, Albertson’s Fed-Ex, Coca-Cola, Ford, Chrysler, Pep Boys, McDonalds, Philip Morris, Disney, Delta Airlines, and many others.

Timing the Market is Difficult, Stay Invested & Add on Dips

There have been many stories written about the success of Peter’s approach and his track record at Magellan. What few people talk about is the path that investors had to follow to receive those returns. Like today, there was plenty of market volatility and frequent drawdowns, yet Peter somehow compounded people’s capital at a very high rate. The trick he said, is to use volatility to your advantage and stay invested for the long-term. In theory that is easy, in practice, it is difficult and requires fortitude and conviction. When stocks are volatile and have drawdowns, like today, the emotional response is to get to the safety of cash because we extrapolate the short-term direction of stocks well into the future.

We tend to do that after a big drawdown has already occurred and typically closer to the bottom in stock prices. Every economic situation is different, but the results seem to be the same: we love holding stocks when markets are calm and stocks are going up and we extrapolate disaster when markets are volatile and the media is painting a bleak picture. This forces us to make irrational, emotional decisions that run counter to our long-term goals. Let me be very clear, when great businesses go on mega-sale, you buy more. So long as the big picture of the business hasn’t changed much, the weakness should be bought.

There is always renewed demand for great brands when they go on sale. Use that knowledge in times like today when some of the greatest businesses the world has ever seen are 20-50% off their recent highs. As you’ve seen from my former blogs, implementing a systematic cost averaging strategy can add significant value around the core position and helps you recover quicker over time. Here’s that recent blog if you haven’t read it: Cost Averaging Adds Significant Value

Being a long-term investor means you will occasionally see some drawdowns. Some are just shallow pullbacks in a bull market, some are more event-driven corrections, and some are inflation and interest rate driven bear markets like we have today. I analyzed Magellan Fund returns while Lynch managed the fund and below are the number of times the fund saw different types of pullbacks.

Data source: Accuvest & Magellan returns via Ycharts

That’s a lot of pullbacks over a 13-year period and if your emotions got the better of you, you lost the ability to generate the returns many of the great brands of yesteryear generated.

“If you can’t banish forever the fatal thought “when I’m down 25%, I’m a seller, you’ll never make a decent profit in stocks” said Lynch in his book, “One Up On Wall Street.”

Peter Lynch had many famous quotes but this is another one of my favorites: “when the market went down, so did the fund, most of the time it went down more than the market, it’s just that simple…expect it.” The graph from Morningstar highlights this fact. The blue line is the Magellan Fund and the green line is the S&P 500. Typically, when markets went lower, the fund also went lower, and it lost more value than the index during those drawdowns.

In the end though, the fund that was driven by one of the greatest investors of all time using a simple, common-sense approach of “investing in what you know”, somehow managed to go on to reach new all-time highs again and again. From a top brands perspective, I have seen this same movie happen over and over for the last 30 years and I expect the same to be true going forward. Great companies that dominate their industries find new ways to win over time. That’s what makes them great brands.

There’s always going to be something to worry about, but remember Peter Lynch’s words:

“Buy great businesses, embrace volatility, be willing to buy more of what you completely understand, and stay invested for the long-term.” This simple process will serve you well during your investment career.

Disclosure:
This information was produced by Accuvest and the opinions expressed are those of the author as of the date of writing and are subject to change. Any research is based on the author’s proprietary research and analysis of global markets and investing. The information and/or analysis presented have been compiled or arrived at from sources believed to be reliable, however the author does not make any representation as their accuracy or completeness and does not accept liability for any loss arising from the use hereof. Some internally generated information may be considered theoretical in nature and is subject to inherent limitations associated therein. There are no material changes to the conditions, objectives or investment strategies of the model portfolios for the period portrayed. Any sectors or allocations referenced may or may not be represented in portfolios managed by the author, and do not represent all of the securities purchased, sold or recommended for client accounts.  The reader should not assume that any investments in sectors and markets identified or described were or will be profitable. Investing entails risks, including possible loss of principal. The use of tools cannot guarantee performance. The charts depicted within this presentation are for illustrative purposes only and are not indicative of future performance. Past performance is no guarantee of future results.

The Last “Lost Decade” Favored Top Brands

Key Points

  • The calls for another “lost decade” in stocks are getting louder.

  • A historical look-back from the last “lost decade”, 2000-2010, shows brands mattered.

  • A brand’s relevancy is vital to a company’s success. Brand relevancy changes over time.

“In good times, brands matter. In difficult times, brands really matter”

Predicting the Future is Difficult

Absolutely no one knows what will happen in the future. When you come across a person or firm that says they can predict the future, ask yourself why they aren’t sitting on a 100-foot yacht in St. Barts versus talking to the media or you about their knowledge of the future. The future is un-knowable because variable always change. Even the most well-thought-out macro view that connects the dots from one factor to another to arrive at an end-projection requires every dot to jive with the others. One breakdown in the macro dot-plot changes every other prediction making the entire prediction less likely. So why try to predict the future at all? Attention is the answer.

The world likes to hear from “smart forecasters” in times of high uncertainty. Not having any ideas about the future is a control-freak’s worst nightmare so these “experts” try to gain attention and to make money catering to your fears.

Here’s a key truth: success in the stock market is more about keeping your emotions in check than actually picking the right stocks. Great companies just win over time; there’s ample evidence of this, along with it being common sense. When investors finally can’t take the volatility and drawdowns anymore, they tend to make the absolute wrong decision at the wrong time. I’ve seen this movie play out over and over in my 30 years of investing. Just remember, buying great companies when they go on big sales is what one is supposed to be doing, not panic selling. Here’s a recent blog talking about that where I show real world examples of the gains that could have been generated if ones emotions were in check: https://catalyst-insights.com/analysis-cost-averaging-adds-significant-value/

As you are well aware, there’s plenty of uncertainty and lots of forecasting going on today. Some very smart, very successful investors have recently been predicting a potential “lost decade” in stocks going forward, Jeremy Grantham (GMO) and Stan Druckenmiller to name a few. We will not comment on the future because it’s un-knowable and therefore a waste of time to try forecasting it. What we do know: human beings earn money, save money, and spend money. Our brand loyalty or brand loathing tends to drive how and where we spend our money. The same is true at the corporate level, it’s less about the emotional connection though, and more about corporate innovation & finding productivity gains. That’s why our team created the Brands 200 Index and why we run an actively managed equity strategy based on B2C and B2B consumption. In good times and bad, consumption is happening. It changes in size and scope according to different parts of the business cycle but the companies that are driving innovation and delighting customers always win in the end.

In great economic environments even average companies perform well, but in more challenging times, arguably like today and potentially in the next few years, only the best companies even have an opportunity to thrive. We have confidence that the most relevant and admired brands serving consumers and businesses will do what they have always done: survive and thrive.

History as a Guide: 2000-2010

As Jim Cramer likes to say, “there’s always a bull market somewhere.” With that thesis in mind, let’s look at the last “lost decade” in stocks, which was 12/31/99 to 12/31/09. Here are some facts:

Lost decades tend to happen when the prior decade was abnormally positive and likely unsustainable.

The 10-year period from 12/31/89 to 12/31/99 saw the S&P 500 Index annualize at about +18.1% versus the normal, long-term average of +9-11%. Based on that statistic alone, one might expect the next decade to be something closer to normal or less than normal. As it turned out, the 10-year period from 12/31/99 to 12/31/09 saw the S&P 500 Index annualize at about -0.95%. (Source: Ycharts.com)

The 2000’s was not a great decade for the market overall. In keeping with this wide lens return thesis, the secular bull market that began March 9, 2009 until the recent highs on November 20, 2021 was also much better than average at an annualized +18.8% return for the S&P 500. The growth stocks from the Nasdaq Index performed even better. Based simply on this historical performance look-back, one could assume the next 10 years might be lower than what we are used to. In fact, as policy rates are normalizing, we should indeed expect more volatility and potentially lower returns than we are used to, at least while the normalization process is happening. In the end though, a world without zero interest rate policy and free money is a very positive development for markets and stocks.

Let’s go back to the 2000-2010 lost decade period and show how a hindsight-focused top global brands basket performed versus the market. It was a tough early part of the decade for tech brands and many other consumer stocks, but overall, an iconic brands basket performed admirably in a tough decade. This all occurred while brands like Apple, Amazon, Microsoft, Disney, American Express, Home Depot, Este Lauder, Coke, and Schwab were down a minimum of 35% of that period. Already I sense the current period is rhyming with yesteryear. As you can see from the Ycharts image below, the 43-stock portfolio, equally-weighted annualized around the long-term average for the lost decade as the overall market struggled. The best companies tend to do much better than peers in the worst of times. They have the brand awareness, the balance sheet, the free-cash flow to invest through the cycle, and they often have the best operating metrics. And all this when we had the Internet bubble bursting, a recession, the 9/11 terrorist attacks, and then the great financial crisis and housing bust of 2008/2007. It’s pretty impressive that a group of companies, let’s call them top brands, somehow found a way to perform over a wild decade with two very bad recessions. Here’s the actual performance of the brands basket and the S&P 500 during the lost decade.

Brand Relevancy Matters Today As Much Or More Than It Did In 2000

As I write this week’s commentary, some of the most admired, most profitable companies (brands) have fallen 30-60% in less than one year. That is a very rare occurrence. You can thank your politicians and the Federal Reserve for this ugly year of returns. Multiples have come back to earth and estimates have been reduced with likely a bit more reductions to come as the effects of high inflation work their way through corporate earnings. If you read last week’s blog, you saw the chart of the 1973/1974 bear market with similar issues as we have today. The market ultimately bottomed as earnings were peaking. That’s counter-intuitive for sure and there’s no way to know if the same will occur this time around but the message from that blog was: markets don’t discount a recession twice. The poor market we have today is in the process of discounting a lot of bad news and stocks will likely bottom well in advance of your fear of these news items. Here’s the link to last week’s blog: https://catalyst-insights.com/where-will-stocks-bottom/

The discounts on great businesses we have today makes investing in the most admired brands a lay-up for investors with a little time. Aside from that observation, let’s get back to a period of difficulty like the 2000’s decade. When looking at the performance chart above, clearly something worked in the last lost decade.

Here’s a few observations from the chart and the holdings in the brands hypothetical portfolio:

  • The brand leaders of this period seemed well positioned from a business perspective.

  • The highest quality companies always invest through difficult times because they can.

  • Investing for market share when peers are re-trenching tends to drive future gains.

  • Being balanced between offense and defensive business models seemed to work well.

  • Bubble stocks tended to lag when the bubble popped and valuations mattered again.

Here’s a look at the hypothetical “most relevant brands” basket that performed so well:

Let’s call that the “sleep well at night” portfolio!

Disclosure:
This information was produced by Accuvest and the opinions expressed are those of the author as of the date of writing and are subject to change. Any research is based on the author’s proprietary research and analysis of global markets and investing. The information and/or analysis presented have been compiled or arrived at from sources believed to be reliable, however the author does not make any representation as their accuracy or completeness and does not accept liability for any loss arising from the use hereof. Some internally generated information may be considered theoretical in nature and is subject to inherent limitations associated therein. There are no material changes to the conditions, objectives or investment strategies of the model portfolios for the period portrayed. Any sectors or allocations referenced may or may not be represented in portfolios managed by the author, and do not represent all of the securities purchased, sold or recommended for client accounts.  The reader should not assume that any investments in sectors and markets identified or described were or will be profitable. Investing entails risks, including possible loss of principal. The use of tools cannot guarantee performance. The charts depicted within this presentation are for illustrative purposes only and are not indicative of future performance. Past performance is no guarantee of future results.

Analysis: Cost Averaging Adds Significant Value

Key Points

  • Core strategies are designed to track core mega trends around the world.

  • Industry leading brands serving important consumption industries win over time.

  • Cost averaging into a basket of brand leaders can add significant additional value.

Brands: The Ideal Core Equity Decision

In last week’s blog, I highlighted the positive long-term track records of a handful of the most admired brands to show how important the consumption thematic is for investors. I also showed the corrections that happen along the way as a reminder that stocks do not always go straight up, nor does a basket of stocks always outperform. Over the long-term, however, the data is very clear. The Consumer Discretionary & Tech sectors have a very strong track record versus the overall market as measured by the S&P 500. Today, it’s important to widen the lens as the Consumer Discretionary & Tech sectors struggle with rising rates and a difficult macro environment. The important point, however, is to not get shaken out of owning great companies when they are underperforming. If you loved these companies and sectors when they were outperforming, you should love them even more now that they are experiencing a rare period of underperformance.

The definition of “core” is the “central” or most important part of something. As a U.S. investor, one of the core parts of our economy is the consumer and household/business consumption. This important component accounts for ~70% of U.S. GDP. To track the beneficiaries of a consumption led economy, the ideal proxies are the leading brands serving this $14 trillion a year thematic. There is no other thematic bigger or more important than consumption. Do you have a consumption-focused core allocation? If so, good news: the leading brands, these key leaders of industry, are on sale. So now is an opportune time to start building positions in these well-positioned businesses. Many of these highly admired brands are trading at levels not seen for many years and their operating metrics are much better than the stock action might indicate.

Track Records Matter. Brands Matter.

For perspective, I have posted a 30-year look-back of the performance of some of the most important consumption brand leaders across key spending industries. When a brand stays highly relevant and continues to dominate its industry, big weakness in its stock has historically been a gift for investors. As you can see from the chart below, there’s some wonderful excess returns to be had if you understand how to identify brand relevancy and hold a core basket of brand leaders. Most importantly, investors only received these stellar long-term returns if they were committed to holding them through good times and bad. I’m sure you’ve seen the Morningstar studies of long-term returns versus the actual returns received by investors. The actual returns tended to be considerably lower because investors tended to panic sell in volatile market conditions like what we are seeing today versus adding to positions when they go on sale.


Data source: Ycharts.com

What I find most interesting about the chart above is the strong excess returns that were generated even through very difficult market environments. Over the last 30 years, we’ve had to endure multiple recessions, bear markets, flash crashes, 9/11, multiple Fed-induced taper tantrums, the European debt crisis, the 2020 Coronavirus, and today’s current high inflationary environment. I can guarantee there will be more turmoil in the future, it’s simply the nature of markets. When you’re sitting in the middle of the hurricane, it always feels like the world and markets will never recover and yet they always have.

Cost Averaging into Additional Shares of Core Holdings Adds Even More Value Over Time.

Having a strong buy-and-hold mentality regarding leading companies has served investors well over the long-term. Remember, the equity markets deliver positive returns roughly 80% of the time. It’s the periods when market leaders are underperforming that offer the best additional long-term opportunities. Catching the absolute bottom is less important than having a systematic approach to adding to great brands, funds, and ETF’s when they are experiencing periods of weakness. Being committed to adding capital during deep corrections has helped to speed up the ultimate recovery time. To illustrate this, I will use two key brands serving the important spending category of restaurants and fast casual dining. The same results would have occurred if I used other leading brands for this analysis. It wouldn’t have mattered if it was Home Depot, Lowes, Lululemon, Nike, Apple, Amazon, Costco, or Estee Lauder. The results were all the same.

Exhibit 1: Chipotle Mexican Grill, CMG

Investing a hypothetical $100k in your favorite burrito brand after their IPO on 1/31/2006 would have turned into a cool $3.6 million by mid-September 2022. Over the same period of time, an investment in the S&P 500 with the same $100k netted an investor ~$431k. I think you would prefer the $3.6M over the $431k!

Cost Average Benefits:

Using this hypothetical example, let’s see if adding to your core position in CMG would have added value to the end result. Let’s say you systematically invested an additional $10k in CMG stock when it was down 25% from the last 12 month high or from the most recent cost average buy level. In the image above, the additional $10k investments when the stock was on sale are noted as blue dots. It’s important to note that you did not have to time the bottom perfectly to receive a huge additional benefit.

The result from this hypothetical is that you would have invested an additional $10k seven times since 2006. This would be worth an additional roughly $284,000 net of the $70k initial investment. Since 2006, your vote of confidence in Chipotle with the core $100k investment and the additional $70k cost average investment would be worth roughly $3.9 million, much better than an investment in the S&P 500.

Exhibit 2: Starbucks, SBUX

Investing a hypothetical $100k in your favorite coffee house brand 30 years ago would have turned into roughly $23.7 million by mid-September 2022. Over the same period of time, an investment in the S&P 500 with the same $100k netted an investor ~$1.6 million. I think you would prefer the $23M over the $1.6M!

SUMMARY:

Thematic investing is a commonsense decision. Global consumption and business investment is a roughly $44 trillion a year thematic. That makes this an ideal core allocation given the definition of core. Identifying the dominant brands in consumption categories and holding them so long as they stay relevant is another logical decision. Adding to these great companies when they experience normal corrections can add even more value to the portfolio over the long-term. If you know how the movie ends (brands tend to outperform over time), being savvy and cost averaging into great businesses when they are on sale, has shown to be a very smart decision. Warren Buffett likes to say, “volatility is the friend of the long-term investor”. We agree whole heartedly and are excited to invest in great brands when the market puts them on sale.

Disclosure:
This information was produced by Accuvest and the opinions expressed are those of the author as of the date of writing and are subject to change. Any research is based on the author’s proprietary research and analysis of global markets and investing. The information and/or analysis presented have been compiled or arrived at from sources believed to be reliable, however the author does not make any representation as their accuracy or completeness and does not accept liability for any loss arising from the use hereof. Some internally generated information may be considered theoretical in nature and is subject to inherent limitations associated therein. There are no material changes to the conditions, objectives or investment strategies of the model portfolios for the period portrayed. Any sectors or allocations referenced may or may not be represented in portfolios managed by the author, and do not represent all of the securities purchased, sold or recommended for client accounts.  The reader should not assume that any investments in sectors and markets identified or described were or will be profitable. Investing entails risks, including possible loss of principal. The use of tools cannot guarantee performance. The charts depicted within this presentation are for illustrative purposes only and are not indicative of future performance. Past performance is no guarantee of future results.

The Chipotle hypothetical cost averaging example highlights the potential power of holding core positions in industry leading brands and being committed to adding to these positions when the market acts irrationally. Cost averaging leading companies can add significant value to your long-term portfolio even if you do not catch the absolute bottom in the stock. Details on this hypothetical are below.

Corrections In Leading Companies Are for Buying

Key Points

  • Corrections & bear markets happen as a normal part of the economic cycle.

  • Even the most admired & profitable brands experience big corrections.

  • There’s always demand for top assets as they go on sale. Buy these dips.

Corrections & Bear Markets Happen. The Upside? They Offer Investors Opportunities

I’m sure you’ve seen the long-term data on equity markets. Historically, equity markets are positive roughly 80% of the time, or 8 out of 10 years. So far this year, they are negative. In addition, the average annual drawdown peak to trough is ~14% (source: J.P. Morgan Guide to the Markets Report). What’s the good news? The statistics show that every savvy investor gets at least one opportunity to buy great assets on sale during shorter-term periods of volatility. That knowledge is your secret weapon as an investor today. While these volatile and down periods never feel good, they do offer investors the ability to build bigger positions in common sense strategies. Every consumer loves the opportunity of a good sale. But for some reason, when stocks are down, investors freeze. If you invest in companies that have a history of long-term outperformance as we do, you’ll likely be very happy at the end of your investment period. More importantly, if you are willing to add to these positions when great brands go on sale, you’ll likely be even happier.

Great Brands Are Not Immune from Corrections & Bear Markets

Intuitively we all know when markets go down, even great companies tend to fall along with markets. Sometimes there’s a reason for these falls, and sometimes the selling of everything takes businesses down even when they shouldn’t be down. That is the opportunity for the wise investor. To illustrate this point, I’ll post the long-term charts of a few of the most admired and profitable brands and highlight the drawdowns they have experienced over time. I’ll also show what the long-term total return of these great brands looks like. The moral of the story is this: if you can identify a leading brand serving an important and growing market, the stock tends to beat plain vanilla benchmarks while potentially experiencing large drawdowns along the way. Intuitively, an investor that’s willing to add to a position when it’s on sale should achieve even greater outperformance. That’s where we can add some real value. It’s impossible to know when the market bottoms for this bear market cycle but I have complete confidence that being savvy and buying more stock of some of the greatest businesses in the world will lead to attractive returns over time.

Exhibit #1: Nike, NKE

Below I’ve included a chart of iconic footwear and apparel brand Nike which dates back to late 1992. There have been multiple deep drawdowns to take advantage of and comparative outperformance over the long-term. Between 9/19/92 and 9/12/2022, Nike stock compounded at +15.1% annual versus the S&P 500 Index at +10.0% and versus the Consumer Discretionary Index at +10.7%. Nike offered a +6,792% return versus the S&P 500 of +1,663.9%.

Imagine what the return would have been if one added to their Nike position on those big drawdowns!

Exhibit #2: Amazon, AMZN

In Amazon, we see multiple drawdowns, including the Internet bubble popping, with AMZN stock down over 90% from the highs. Poorly run companies never recover from drawdowns. Great companies with visionary management and enormous growth opportunities use tough times to broaden their markets and take market share. Over the period of 5/14/1997 to 9/12/2022, Amazon stock compounded at roughly 34% per year versus the S&P 500 performance of roughly 8.5% per year. The Consumer Discretionary Index compounded at about 10.4% per year.

Imagine what your return would have been if you added to the Amazon position on those big drawdowns! Our team utilizes big sales to buy more of the top brands.

Exhibit #3: Blackstone, BX

One of the biggest, most long-lived mega-trends we know of is still very much alive. A portion of the assets from institutions, insurance companies, and consumers are migrating away from traditional stocks and bonds and moving into “alternatives” like real estate, real assets, infrastructure and private credit. The leading brands benefitting from this migration are Blackstone and KKR, two of the top private equity firms. In fact, these firms get stronger in times of chaos. Collectively, the PE industry has about $3 trillion in dry powder that helps them take advantage of the dislocations happening all around the world. Blackstone is the heaviest hitter in PE. Their real assets category and stock have performed incredibly well since their 2007 IPO. To receive great returns, you had to be willing to endure some gut-wrenching drawdowns. With hindsight, you could get out and then hope to get back in lower, but very few investors have that skill. We prefer to hold a core position in our favorite brands and add to them meaningfully when they go on sale. Blackstone stock has annualized at ~14.4% since the IPO in late June 2007 versus the S&P 500 at 8.9% and the Financial Services Index at 3%. BX offered a 680% return versus the markets 267% return.

Imagine what your return would have been if you added the Blackstone position on those big drawdowns! In 2008, Blackstone assets under management was $94 billion, today AUM is roughly $1 trillion. That’s a lot of stable fee revenue, folks.

Exhibit #4: Chipotle, CMG

Chipotle remains the most dominant fast casual restaurant chain in America. When the company is saturated in America, Chipotle’s great management team will grow internationally. Even with the E. coli issue in 2015-2016, the stock has compounded significantly better than the market or the sector index. To achieve this long-term return, you had to avoid being shaken out during big drawdowns. When the business changes forever, you move on, when the business is simply experiencing short-term issues and a falling stock price, you take advantage and build bigger positions. Annualized returns of 27% versus the markets roughly 11% were well worth the patience, in my opinion.

Exhibit #5: Estee Lauder, EL

I won’t pound this drum anymore; you get the picture! Big drawdowns, strong long-term outperformance. Buy the dips in quality leaders.

SUMMARY:

It’s very easy to sell when markets are struggling, it’s an understandable yet emotional response to sell. What’s difficult, however is getting back into the market. The best buys are often when it feels most scary, that’s just the nature of markets. The Consumer Discretionary, Technology, and Communications sectors have a long history of outperformance versus the S&P 500, but it doesn’t happen every year. These three sectors are generally where the most admired and profitable brands live. Most of the top brands have experienced large pullbacks in their stocks yet very few things have changed from a fundamental perspective. Investors are once again getting a great opportunity to build positions in great brands on sale. History shows you buy these sectors when they have underperformed for 1-2 years. Revenue growth, EPS growth and free cash flow growth rarely happen in a linear fashion. But leaders of industry, aka top brands, take market share and get stronger in times of turmoil. When markets go on sale, leaders with strong track records of outperformance have historically been very savvy decisions. No one knows where markets will go in the short-term but buying great assets when on sale is a prudent, logical, and wise thing to do. That’s exactly what we, at Accuvest Global Advisors, are doing.

Disclosure:
This information was produced by Accuvest and the opinions expressed are those of the author as of the date of writing and are subject to change. Any research is based on the author’s proprietary research and analysis of global markets and investing. The information and/or analysis presented have been compiled or arrived at from sources believed to be reliable, however the author does not make any representation as their accuracy or completeness and does not accept liability for any loss arising from the use hereof. Some internally generated information may be considered theoretical in nature and is subject to inherent limitations associated therein. There are no material changes to the conditions, objectives or investment strategies of the model portfolios for the period portrayed. Any sectors or allocations referenced may or may not be represented in portfolios managed by the author, and do not represent all of the securities purchased, sold or recommended for client accounts.  The reader should not assume that any investments in sectors and markets identified or described were or will be profitable. Investing entails risks, including possible loss of principal. The use of tools cannot guarantee performance. The charts depicted within this presentation are for illustrative purposes only and are not indicative of future performance. Past performance is no guarantee of future results.

A Playbook for Investing in Structurally Higher Inflation

Key Points

  • Our playbook for inflation investing comes in two stages.

    • Stage 1 began in early June & should be shorter in duration.

    • Stage 2 could last a year or two and few portfolios are positioned toward winners.

Our Inflation Investing Playbook

The distortions that have been created by COVID and the policies surrounding it continue to create noise across markets and corporate fundamentals. Make no mistake, the current market environment is one of the most unique I have seen in the 30 years I have been investing. I do not remember when so many macro factors had to play into our stock selection process. Supply chains have been disrupted, de-globalization is gaining momentum as countries and companies build new capabilities closer to home, and the price of almost everything is much higher than it was two years ago. Even as certain goods and services fall in price off lofty highs, they are likely to stabilize at higher levels than we are all accustomed to. If you have taken your vacation this summer, you have experienced higher lodging, food and beverage costs, air travel, and rental car pricing. Everywhere we turn, it’s more expensive.

As I listen to corporate earnings calls, the evidence points to companies that are continuing to raise prices to combat higher labor costs even as input costs for their businesses begin to roll over. In the most vital commodities, there continues to be a structural supply/demand imbalance which likely keeps prices higher for longer. Not to mention, from a geopolitical perspective, most countries that produce and sell commodities have a vested interest in keeping prices higher as the sustainable energy movement begins to take hold. Once inflation begins, it often gets entrenched for a period until demand falls and/or supply rises enough to push prices down. The bottom line: we are not going to see the Feds 2% inflation any time soon. That could keep the Fed more hawkish, interest rates well bid and volatile, and inflation higher for longer.

Consumers have already begun making decisions based on higher prices. There will be big winners and losers which makes stock picking a very important portfolio position for the next 12-24 months. Not every company is well suited for the environment we are in, and the most relevant brands will be taking market share. That’s where our team is focused from a stock selection perspective.

Stage 1: Investing in “Peak Inflation”

Just before the beginning of the June rally, positioning to equities was incredibly bearish, sentiment was extreme, and markets were very oversold. That is generally a pretty good set-up for a strong counter-trend rally. Markets rallied incredibly strongly, and the rally was very broad, which is generally very healthy. A few months ago, I noted that the first stage of this rally would likely come from the realization that a peak in the rate of change for inflation was in and inflation would slightly ease going forward. Thus far, we have seen this peak inflation reading and markets have responded favorably. The rally was likely robust simply because the entire market was positioned for max bearishness and increasing inflation versus a peak reading.

In my opinion, the Stage 1 rally has largely happened, and positioning is more appropriate for the market environment we are in. The Stage 2 portion of investing in an inflationary period should prove to be much longer in duration and will likely wear both bulls and bears out if their approach is buy & hold. Our base case is to be more active, trade the big ranges, and tilt heavily toward price makers, market share takers, and brands that sell products and services that are needed and or required. We are much more concentrated than normal because the market requires it.

Stage 2: Investing in “Structurally Higher Inflation”

If I had to guess, inflation is likely to average 4-7% for the next few years. The level is less important than the fact that inflation should stay elevated for longer than people think. In a period when growth is constrained and inflation stays elevated, the traditional 60/40, 70/30 portfolio likely underwhelms advisors and investors. Not every stock performs well, and bonds will likely be much more volatile than any of us are comfortable with.

The Playbook: 1968-1975

During this period, inflation averaged about 6.3% and was not transitory. Because of the structural imbalances across much of the commodity complex, housing stock (rentals in particular), and stubbornly higher labor shortages, it is not difficult to make an inflation call for “higher for longer.” Countries across the world witnessed how vulnerable their supply chains are and the friction between the West and China seems only to get more acute. If we look back at former periods with higher inflation, the 1968-1975 period seems quite similar, although not exactly the same. Here’s a chart and summary of this period as a guidepost:

  • S&P 500 annualized return for 8 years was ~3.3% for a negative REAL return.

  • Inflation as measured by CPI averaged ~6.2%

  • Wild volatility across the interest rate, commodity, and equities complex.

  • Big drawdowns: -36%, -14%, -48% mostly tied to up trending CPI & interest rate readings.

  • Big rallies: +51%, +33%, +53% mostly tied to stubbornly high but falling CPI & interest rate readings.

  • Interest rates as measured by the 10 Year Gov’t bond averaged 6.6%.

Summary:

Investors have been blessed with low and falling rates, cheap access to capital, an accommodative central bank, low inflation, and stable growth since 2009. That environment has favored a basic stocks, bonds, and cash type of portfolio. With rates higher (and likely to be volatile), inflation sticky and higher for longer, a hawkish Fed and higher cost of capital, valuations for most stocks should be lower than the last 13 years and will become much more important, the quality of the balance sheet and business becomes more important and being the price maker and market share taker is vitally important for better forward returns than the indices might offer. Portfolios need more exposure to price makers, leading companies that set prices and have loyal customers and/or that are the go-to brands for the business they are in. Ones that manage their businesses well and can offer attractive pricing to consumers while not suffering from the margin erosion (Costco comes to mind) that second and third tier companies will experience.

One key mega-trend we have been talking about for 6+ months is the massive migration of assets from traditional stocks and bonds to alternative assets like inflation-protected bonds, real assets, commodities, real estate, and other assets that have inflation kickers built into the business models. That’s why our consumer brand focused Fund’s top two holdings are Blackstone and KKR. They have been investing assets into inflation winners for many years and have a combined ~$300 billion of dry powder to take advantage of the distress created by structurally higher inflation, volatile markets, and illiquid credit markets. We also have an overweight position in the leading energy brands – Chevron & Exxon – that should benefit from a poor supply/demand picture and higher and stable commodity prices.

The next few years should be very different than we are accustomed to, and they will require a different asset allocation than we have needed for the better part of 35 years. When the facts change, the allocations also must change. Carpe diem!

Disclosure:
This information was produced by Accuvest and the opinions expressed are those of the author as of the date of writing and are subject to change. Any research is based on the author’s proprietary research and analysis of global markets and investing. The information and/or analysis presented have been compiled or arrived at from sources believed to be reliable, however the author does not make any representation as their accuracy or completeness and does not accept liability for any loss arising from the use hereof. Some internally generated information may be considered theoretical in nature and is subject to inherent limitations associated therein. There are no material changes to the conditions, objectives or investment strategies of the model portfolios for the period portrayed. Any sectors or allocations referenced may or may not be represented in portfolios managed by the author, and do not represent all of the securities purchased, sold or recommended for client accounts. The reader should not assume that any investments in sectors and markets identified or described were or will be profitable. Investing entails risks, including possible loss of principal. The use of tools cannot guarantee performance. The charts depicted within this presentation are for illustrative purposes only and are not indicative of future performance. Past performance is no guarantee of future results.

Thematic Investing: A Look into Key Megatrends Driving Global Economies

Megatrend #1: Trillions of Dollars are Migrating to Alternative Assets

Mega Brand: Blackstone (BX), the Biggest Beneficiary of this Megatrend

Key Points

  • Thematic investors focus on megatrends and the brands that stand to benefit most.

  • There is no bigger megatrend in financial services than the migration of assets to Alts.

  • Blackstone, the Apple of the Private Equity Business, benefits most from this pivot.

“There is an undeniable secular pivot in asset management allocations …non-correlating assets are being added to retail and institutional portfolios and this is a multi-decade secular opportunity”
- Stephen Schwarzman, Founder, Chairman and CEO of The Blackstone Group

Thematic Investing

As you know, our team at Accuvest created the Dynamic Brands Strategy to invest in the global consumption primary thematic. Consumers and institutions spending >$40 trillion per year is the largest addressable market opportunity there is. Within the primary thematic, there are a few mega-trends that offer investors significant investment opportunities. There are not many global consumption-focused investors and there are even fewer dedicated mega-trends investors. We think that’s a big mistake and in the next few posts I’ll highlight a few of the multi-decade megatrends we see for investors. To be clear, a megatrend is a secular shift in a current industry or sector that will alter the landscape and usher in a massive opportunity for the leading brands serving the megatrend. The Dynamic Brands Strategy is very unique because the portfolio contains leading brands serving multiple megatrends within a general theme of global consumption.

Megatrend #1: The global pivot in asset allocations to non-correlating assets.

If you have not added any non-correlating and alternative assets to your portfolios, you will eventually. Why? Because they can add a significant amount of value, return and risk mitigation to the overall portfolio mix. The current traditional fixed income market offers more risk than ever because rates are more volatile and returns and yields have never been this unattractive. The partial shift away from traditional fixed income is early in its infancy and the fixed income market globally is greater than $120 trillion in size. Equities have always been volatile at times and with valuations higher than normal, future returns broadly could be less than average over time. Cash earns nothing and there is over $5 trillion sitting in cash being eaten away by inflation. Now compound that globally and you will uncover a solid opportunity for the alternative asset managers around the world.

Why will assets continue to shift? Let’s use one of the top Endowments as a guide. The Yale University portfolio holds about $43 billion in assets and is consistently a top performing Endowment in a very competitive peer group. Generally, if the smartest firms around the world are doing something consistently, we should all endeavor to emulate their approach. Here’s a few statements from the Yale Investments site:

Over the past 30 years, relative to the median endowment, Yale’s asset allocation has contributed 1.9% per annum of outperformance and Yale’s superior manager selection contributed an additional 2.4% per annum.  The heavy allocation to non-traditional asset classes stems from their return potential and diversifying power. Alternative assets, by their very nature, tend to be less efficiently priced than traditional marketable securities, providing an opportunity to exploit market inefficiencies through active management.

If virtually every institutional investor, the most sophisticated ultra-high net worth investors, and major insurance companies have made the decisions to pivot away from the traditional, stocks, bonds, and cash approach to asset management, shouldn’t every investor consider it? This megatrend is in its infancy which is why Blackstone is raising assets and fee revenue at a scale I have never seen in my career.
We think this will continue for many decades and the assets these PE firms will raise over the next few decades will truly be astonishing. Just to drive home the total opportunity, below is a look at Blackstone’s market share in the U.S., and you’ll see there’s so much room for market share gains here:

New strategies are continuously being created and this will continue as the world evolves. When an attractive thematic presents itself, the savvy PE firms often create funds so investors can gain access to what they see as an opportunity. The more credibility a firm has, the more repeat business they get when they create new funds. This creates a wonderful network effect and a recurring revenue, cash flow machine. These factors often drive a stock to be a superior outperformer.

Generally, these PE firms employ some of the smartest, most connected professionals around the globe. These super-smart investors see future trends before most others and they have epic amounts of capital to capitalize on these opportunities. In fact, these firms benefit most during every period of turmoil because they are often the buyers of last resort and get the best prices for assets in distress. They capitalize most on the concept of “buying when there’s blood in the streets” even when some of the blood is their own. Because these firms currently have staggering amounts of dry powder at their disposal, they stand to benefit most, over the long-term, from every single worry that we all currently have. Example: are you worried about inflation? Why not invest in the areas of the global economy that benefit from rising rents and inflationary pressures. See the opportunity in climate change innovation? Invest in a fund that holds the significant beneficiaries of the global flows into climate change including being the private credit provider for these technologies. I cannot think of a better allocation today than turning some of your hard-earned money over to the smartest investors in the world. These firms now manage hundreds of billions in permanent capital. They benefit greatly from management fees, incentive fee’s, follow-on investment decisions, and the compounding of the assets via strong performance over time. I’m not sure most investors understand how powerful this flywheel is and I’m very confident most investors do not own the stocks of these great PE firms in their portfolios.

Blackstone: BX

This 36-year-old investment firm now manages $881 billion and has stated it is confident in hitting the $1 trillion mark in assets by year end. In our opinion, Blackstone has an unprecedented amount of runway for additional AUM growth given the sheer size of the global assets market. Case in point: there’s about $125 trillion invested in global equities and about $128 trillion in the global bond markets (sifma.org). Additionally, if Blackrock can manage >$7 trillion, Vanguard >$6 trillion, J.P. Morgan Asset Management >$2.5 trillion, Goldman Sachs >$2 trillion and they are largely focused on the markets that are net losers of assets to the alternatives market, why can’t the 800lb gorilla in the PE business, BX, eventually manage $2-$5+ trillion? This impressive brand is already generating significant amounts of management and advisory fee’s (FRE)

At $881 billion as of 12/31/21, the business has scaled to the point where recurring revenue and earnings predictability will be high and stable. Businesses with high recurring revenues and strong earnings stability are awarded with higher earnings multiples. Blackstone currently trades at a 15 p/e, yields 3.5%, is growing that dividend handily, has incredible profitability with unprecedented growth opportunities, and currently has over $135 billion in dry powder to take advantage of future dislocations and secular opportunities. The business is simply too cheap when compared to the secular opportunities they are benefitting from and the stability of the earnings that will be generated over time. That’s why BX is the top holding in the Dynamic Brands strategy. To be clear, BX is still a stock and given the nature of their business, it can be volatile at times when economic growth is in question. But when you see a secular growth opportunity like the migration of trillions in assets, you use volatility to your advantage, and you continue to accumulate shares like an opportunist should.

Blackstone stock has been a monster outperformer since the 2007 ipo.

Since June 2007, Blackstone stock generated a total return of ~950% as of 3/1/2022 versus the SandP 500 return of roughly 294%. That’s an annualized gain over the SandP 500 of just over 800bps per year that could have been generated if an investor simply understood the secular trends under way. That is why we focus on megatrends and own the Mega-Brands that dominate these industries.

We think the future is very bright for the industry and leaders like Blackstone.

Disclosure: This information was produced by and the opinions expressed are those of Accuvest as of the date of writing and are subject to change. Any research is based on Accuvest proprietary research and analysis of global markets and investing. The information and/or analysis presented have been compiled or arrived at from sources believed to be reliable, however Accuvest does not make any representation as their accuracy or completeness and does not accept liability for any loss arising from the use hereof. Some internally generated information may be considered theoretical in nature and is subject to inherent limitations associated therein. Any sectors or allocations referenced may or may not be represented in portfolios of clients of Accuvest, and do not represent all of the securities purchased, sold or recommended for client accounts. The reader should not assume that any investments in sectors and markets identified or described were or will be profitable. Investing entails risks, including possible loss of principal. The use of tools cannot guarantee performance. The charts depicted within this presentation are for illustrative purposes only and are not indicative of future performance. Past performance is no guarantee of future results.


The Most Important Theme of 2022: Historic Consumption Capacity

Key Points

  • Human beings are very predictable. Predictability offers strong investment opportunities.

  • In aggregate, U.S. households have never had more consumption capacity.

  • >$4 trillion in consumption capacity is so large that it offers a multi-year consumption tailwind.


This has never happened in history.

Investors have a seemingly endless number of macro and micro datapoints to evaluate in the hopes of gaining an investment edge. We track the health of the U.S. economy through the lens of its primary driver, the consumer, and the chart above from Hedgeye Research highlights one of the most bullish datapoints we have ever seen. The consumer has a $4 trillion consumption cushion. The sheer size of this cash pile indicates that there will be a slow and steady trickle into our consumption economy for years to come. This is not to say there won’t be periodic bouts of volatility, especially as the Fed begins to taper their asset purchases and interest rates normalize. Nevertheless, investors need a dedicated allocation to the global consumption theme. Consumption drives the economy and due to COVID-lockdowns, fiscal stimulus, monetary stimulus, and deferred spending by consumers all over the world, there is now more money reserved for future consumption than ever before. Additionally, the wealth effect has never been more robust. Home equity levels and stock market wealth have never been higher. Finally, an estimated $30+ trillion is just beginning to pass from older Americans (baby boomers and the silent generation) to their Gen-X and Millennial children.

The vast majority of consumers are very predictable. When we have excess cash we save a little, invest a little, and spend a lot.

It is not just the consumer that is sitting on cash. Many of strongest corporations are currently flush with $2 trillion in cash on their balance sheets. Goldman Sachs predicts the level will rise to $3.1 trillion by the end of 2022. This offers an enormous buffer for the inevitable clouds that will emerge in the future. There will be continued buybacks, massive cap-ex cycles, R&D spending, dividend increases and a continuation of strong M&A trends. In fact, if politicians decide to tax buybacks, more money will likely flow to M&A than ever before. M&A deal value YTD by U.S. firms is already over $1.1 trillion, the highest level on record. We expect it to continue.

We have invested in the brands that are primed to benefit from these phenomena. They are still cheap, have fortress balance sheets, and are incredibly well positioned for what’s to come.

Consumption Booster Shot in 2022: Rising Wages

Source: Bloomberg, Hedgeye Risk Management

One of the biggest boosts to overall consumption capacity is rising wages. This important factor has largely been absent for as long as I can remember. But times have changed and employees now have massive leverage. Wage pressure is a blessing to consumers.

As the economy gets closer to full employment wage pressure should subside which can keep a lid on interest rates. But the rising wages of the “already employed” is much stickier than other inflation metrics. We favor businesses that will not experience significant drag from labor inflation.

Our team spends enormous amounts of time understanding and identifying the brands that sell high demand products and services with an ability to raise prices without crimping demand (pricing power). Many of 2022’s best performers will be the leading brands in key consumption industries that have pricing power and the ability to attract the most qualified workers. We suspect “wage pressure” and “an inability to find enough workers” will be key buzz words referenced on quarterly conference calls for at least another year. For consumers, however, a higher wage is a very positive development for consumer sentiment, which ultimately drives purchase intent. Higher wages for lower income consumers tends to get spent more quickly, adding to the consumption component of GDP and the revenue lines of the most relevant brands serving this cohort.

In 2022 total consumption should be broad-based given the large the savings glut. But our analysis has found that consumer services in particular are poised to revert back to the mean.

GDP Booster Shot in 2022: Inventory Rebuild

Source: Bloomberg, Hedgeye Risk Management

Supply chain bottlenecks (shipping delays, port delays, lack of trucking capacity, etc) have contributed to rising prices and to a reduction in inventories across most industries. While this is a source of frustration for consumers, it is great news for corporate margins and revenues. Revenue and cash flow feed directly into corporate earnings, which ultimately drives stock prices.

A historic inventory rebuild cycle will begin once supply is available again. When demand has been satiated and inventory has been re-built, prices (inflation) will normalize to lower levels. That will in-turn allow consumer sentiment to normalize back to more attractive levels. Inventory rebuilding and better job gains should allow GDP growth to stay “above trend”. The Covid normalization process will take time and the re-boot process has created distortions. While prices for every good and service are high, remember that there can be no better hedge to our spending then the capital gains we can generate from investing in the brands we know, trust and love. Embrace this epic consumption opportunity, it has a very long tail.


Summary:

·         Consumers have a record amount of cash that can be used for future consumption.

·         Consumers have significant leverage for higher wages which flows to higher spending.

·         A historic inventory rebuild cycle should allow GDP growth to stay above-trend.

·         Stability of earnings and strong pricing power ultimately flow through to better earnings and higher stock prices.


Disclosure: This information and the opinions expressed are those of the author as of the date of writing and are subject to change. Any research is based on the author’s proprietary research and analysis of global markets and investing. The information and/or analysis presented have been compiled or arrived at from sources believed to be reliable, however the author does not make any representation as their accuracy or completeness and does not accept liability for any loss arising from the use hereof. Some internally generated information may be considered theoretical in nature and is subject to inherent limitations associated therein. There are no material changes to the conditions, objectives or investment strategies of the model portfolios for the period portrayed. Any sectors or allocations referenced may or may not be represented in portfolios managed by the author, and do not represent all of the securities purchased, sold or recommended for client accounts. The reader should not assume that any investments in sectors and markets identified or described were or will be profitable. Investing entails risks, including possible loss of principal. The use of tools cannot guarantee performance. The charts depicted within this presentation are for illustrative purposes only and are not indicative of future performance. Past performance is no guarantee of future results.


The Consumer Services Rebound

• The Consumer Services segment of the economy continues to heal from very depressed levels

• The leading Consumer Services brands have tremendous tailwinds

• Most investors do not own a dedicated allocation to Consumer Services stocks. Now is the time to add to this exposure

Services dragging.png

As the chart above shows, the Consumer Goods category (blue) has been the driver of U.S. GDP over the last year. Many of the best brands that dominate these industries have shown incredible resilience during difficult times and their stocks have performed very well. At this point though, tailwinds are likely turning into headwinds from valuation and year-over-year comparison perspectives.

In my opinion, this group has carried the consumption component of GDP as far as it can, and the real opportunity continues to be in the recovery of the Consumer Services segment (yellow) of the economy. Services fell off a cliff in Q2 of 2020 for obvious reasons and with vaccinations and boosters continuing to be adopted, lockdown fatigue and a move towards ultimate herd immunity, the mean reversion in the services sector should accelerate even faster.

The desire for normalcy should keep consumers focused on services after they have binged on goods consumption for the last 18 months. My team and I are focused on finding the best potential winners for 2022 and many of them will likely come from the services sector.

Opportunity in Recreation, Travel, Experiences and Personal Services

Handful driving shortfall.png

The chart above spells out a wonderful investment opportunity for astute investors: Services such as live entertainment, sporting events, concerts, air travel, lodging, amusement parks, gyms and ground transport are still depressed relative to long-term norms.

However, in order to identify specific opportunities, one must do some additional work. Because of massive fiscal and monetary stimulus, many of these stocks are already trading well above their 2020 peaks. Additionally, some companies (travel stocks in particular) have had to raise tons of debt just to survive the pandemic. Significant levels of debt often act like an anchor to a company’s potential growth and add risk to the business if they cannot grow their way out. My team and I have been doing rigorous research to identify the brands that have the best snap-back opportunities. We are particularly interested in those that do not have excessive debt that may curtail forward growth.

It’s important to remember that some great businesses will use any lift in their stock prices to raise capital to pay off near-term debt. Short-term, that could be dilutive to shareholders, but it will ultimately help these companies reduce debt and re-invest back into the business to re-build their workforce and offer consumers better experiences. We couldn’t be more excited to be investing in some very relevant brands across the services and experiences segment of the economy.

The Tailwinds are Clear

tailwinds clear.png

We must keep in mind how the consumer behaves in normal times. In so doing, we are able to jump on short-term anomalies as mean reversion opportunities. As the chart above shows, the services component of personal consumption remains below January 2020 levels. We have no doubt that the services sector will continue to heal.

This reversion to normalcy presents a wonderful opportunity for investors.

Disclosure: This information was produced by and the opinions expressed are those of Accuvest as of the date of writing and are subject to change. Any research is based on Accuvest proprietary research and analysis of global markets and investing. The information and/or analysis presented have been compiled or arrived at from sources believed to be reliable, however Accuvest does not make any representation as their accuracy or completeness and does not accept liability for any loss arising from the use hereof. Some internally generated information may be considered theoretical in nature and is subject to inherent limitations associated therein. Any sectors or allocations referenced may or may not be represented in portfolios of clients of Accuvest, and do not represent all of the securities purchased, sold or recommended for client accounts. The reader should not assume that any investments in sectors and markets identified or described were or will be profitable. Investing entails risks, including possible loss of principal. The use of tools cannot guarantee performance. The charts depicted within this presentation are for illustrative purposes only and are not indicative of future performance. Past performance is no guarantee of future results.


July Retail Sales: Focus on the Story Behind the Headlines

  • The July Retail Sales headline was incredibly misleading – the reaction offered an opportunity.

  • The U.S. consumer continues to be healthy and very particular about where spending happens.

  • Overall Retail Sales will continue to mean revert but spending is expected to stay elevated.

Source: lao.ca.gov for the retail sales chart, Accuvest for the channel lines and notations.

Source: lao.ca.gov for the retail sales chart, Accuvest for the channel lines and notations.

Retail Sales

Drawing conclusions about the state of mind of consumers from one month to the next can be dangerous to your wealth. Our spending can be episodic in the near term, but when you look back over one year, it’s highly predictable. Yesterday’s report of July Retail Sales falling 1.1% from June to July is noise. It was to be expected yet the market used this and other geopolitical factors to push down everything, including retail stocks across the board. Why? Because algorithms trade off of headlines and do not read data or trends very well. As the chart above shows, consumers have been “revenge-spending” after months of forced savings and lockdowns. This has pushed the overall Retail Sales numbers to unsustainably high levels, and we should expect mean reversion to occur. Data is beginning to revert back into the long-term up channel. For investors in the consumption space, the most important factor is the trend, and consumption has continued to grind higher for decades.

When COVID-19 shut down the economy, Retail Sales fell off a cliff for a short period of time. Again, it was to be expected. As the world gets back to normal, a normalization of Retail Sales trends will occur. Bottom line: the month-to-month changes in spending trends are just noise and do not offer much in the way of investment edges. What does offer a significant opportunity is fading or aggressively adding to great brands when the market gets irrational about frequently reported economic data. The consumer is still healthy and has excess savings that will be drawn down over the next 12 months. With the rolling correction that’s already occurred in markets, there’s a lot to like about the markets even though the conventional wisdom focuses only on the index-level results. I will continue to add to my favorite retail brands on sell-offs.

Source: Bloomberg

Source: Bloomberg

Consumer Balance Sheets Remain Healthy

Last I checked, there is still well over $4 trillion in money market funds, home values are at all-time highs, wages are increasing, and job growth is accelerating. Not to mention, consumer savings rates are still elevated at 9% vs a normal 7% level. That’s still about $2 trillion in savings that will continue to trickle into the economy over the next year or two.  That, my friends, is a nice tailwind for the overall consumption thematic.

Prices for goods and services are elevated currently. The latest consumer sentiment readings reflect this. High prices force people to prioritize purchase decisions. Which spending categories make the most sense today? Which brands are the most relevant in each of these categories to me? How much money am I willing to spend on items I need? People start deferring purchases in one area to focus on others. This presents an excellent opportunity for active stock pickers.

When consumers’ stop revenge spending and get more price sensitive, competition will start heating up for the consumer wallet and lowered prices will be the net result. Some brands have great pricing power because their products and services have high demand, we try to find these stocks for the portfolio. For most industries and categories though, it takes just a few big brands getting more focused on cutting prices before most peers start following along. Overall, that’s great for spending trends and better consumer sentiment readings looking forward.

Elevated Consumer Spending: The Trend is Your Friend

The most important take-away from the first chart in this blog: The long term Retail Sales trend will remain stable while being volatile month to month. Predictability is a key item people want in a portfolio and I know of nothing more predictable than a consumers’ propensity to spend.

Let’s look at the big picture in Retail Sales:

Overall, we saw spending +13% year over year even if the data decelerated off unsustainably high levels. People love to only focus on the rate of change but let’s also realize the absolute numbers were very robust. Restaurants and bars were up 38% YOY and clothing & clothing accessories were up 43% YOY. Autos were soft likely because of difficult to find inventory, there’s clear demand across conventional and electric vehicles currently but supply is challenged. E-commerce was also a bit soft which should be expected given we are all out and about and focused on vacations.

~70% of GDP is consumer spending so no one should be surprised to see an easing of retail spending and GDP, it’s at unsustainable levels and needs to normalize. Here’s the fun part, when GDP and consumer spending falls off a cliff, there’s a high correlation of strong consumer stock returns as the normalization occurs off very depressed levels but I have found zero correlation to the direction of consumer stocks when the data is very robust and set to normalize lower. This makes these silly narratives and sell-offs a great opportunity for long-term consumer investors.

With prices high across most spending categories, we should expect consumers to be more price conscious and discriminating about what they buy, where they buy and what price they are willing to pay. With high prices, we shouldn’t be surprised by how robust the buy now-pay later business trends are. This added purchase option really helps people keep buying while helping them manage their checking balances. Eventually, supply chain disruptions will ease, shipping rates will normalize and prices of goods will fall back to normal levels. Because the disruptions have been so severe as demand returned with a vengeance, it could take a number of months longer to a return to a normal pricing environment. The brands that have the most relevancy with consumers will maintain pricing power with little change in demand. That ultimately spells better financial metrics in future quarters.

Summary:

  • Current Retail Sales are in the process of normalizing from unsustainable levels.

  • Overall, consumer spending should stay strong for longer given high savings rates.

  • Consumers are starting to discriminate across their spending categories. Brand relevancy is critical to sustaining the current revenue and margin structure of companies.

Disclosure: This information was produced by and the opinions expressed are those of Accuvest as of the date of writing and are subject to change. Any research is based on Accuvest proprietary research and analysis of global markets and investing. The information and/or analysis presented have been compiled or arrived at from sources believed to be reliable, however Accuvest does not make any representation as their accuracy or completeness and does not accept liability for any loss arising from the use hereof. Some internally generated information may be considered theoretical in nature and is subject to inherent limitations associated therein. Any sectors or allocations referenced may or may not be represented in portfolios of clients of Accuvest, and do not represent all of the securities purchased, sold or recommended for client accounts. The reader should not assume that any investments in sectors and markets identified or described were or will be profitable. Investing entails risks, including possible loss of principal. The use of tools cannot guarantee performance. The charts depicted within this presentation are for illustrative purposes only and are not indicative of future performance. Past performance is no guarantee of future results.