

Market Re-Cap
Performance Heatmap:
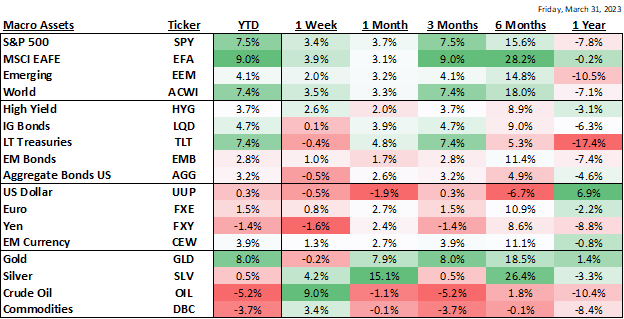
Source: Bloomberg
Both equities and fixed income posted strong returns in Q1 as the global economy avoided recession, China continued to re-open, the US labor market remained strong, and lower energy and oil prices helped reduce inflation.
In equities, on the back of successful efforts to rebuild gas reserves and a milder-than-expected winter, European equities outperformed. In the US, large cap growth dominated, with mega-cap stocks such as Apple, Amazon and Microsoft exhibiting relative strength. From a sector perspective, technology and communications outperformed while financials and energy lagged. In fixed income, falling interest rates rewarded duration, with the U.S. Aggregate Bond Index returning 3.2% and long-term Treasuries up a full 7.4%. Credit spreads also remained contained in Q1, helping high yield bonds.
While financial markets may have ended the quarter on a high note, investors were exposed to major bouts of volatility in the iterim. The month of March in particular was a roller coaster ride as the collapse of Silicon Valley Bank (SVB) led to fears about the stability of the banking system. The bond market was shaken, with the most widely watched gauge of bond market volatility - the ICE BofA MOVE index - surging to the highest level since 2008. Fears of deposit flight subsequently caused bank lending to pull back, thereby tightening financial conditions (see chart) and, according to most economists, increasing the probability of a recession.

Source: Bloomberg
And yet, by the end of the month, markets had closed higher. This is largely because investors increasingly believe the fallout from the SVB debacle will lead to an imminent pause in the Federal Reserve’s rate-hiking cycle. Indeed, over the course of the month, the 10-year Treasury yield declined by nearly 50-basis-points and the entire Fed funds futures curve was repriced significantly. As many as four rate cuts are now anticipated by January 2024 and the yield curve, while still inverted, has steepened meaningfully.
Spotlight on Banking Stability
Another reason markets moved higher is because contagion fear in the banking system is contained. The market views SVB’s collapse as idiosyncratic in nature and a systemic crisis as highly unlikely. Flush with deposits from fast-money Venture Capital firms and other corporate accounts at a time of historically low interest rates, SVB failed to adequately match duration between its high-quality assets and deposit liabilities. As higher capital costs prompted corporate outflows, SVB was forced to sell its long-term Treasuries, the value of which had plummeted as interest rates rose. A capital raise to cover those losses failed, and a run on deposits occurred. Ultimately, regulators were forced to step in and ensure deposits. This aggressive action, alongside historically strong liquidity and capital positions at larger US institutions, appears to have minimized systemic risk and calmed markets. Measures of funding stress are well behaved, and the Federal Reserve has offered extraordinary liquidity through its discount window.
In short, we do not see systemic risk or similarities with the 2008 financial crisis. The financial crisis originated in cheap credit and lax lending standards. This is not the case today as lending standards have tightened significantly in the past 15 years and banks have steadily been increasing their tier 1 capital ratios (see charts).

Source: (Left) Federal Reserve Bank of New York, Refinitiv Datastream, J.P. Morgan Asset Management. Mortgages are grouped by FICO score. Subprime are those with FICO scores below 659, prime those between 660 and 759 and superprime those above 760. (Right) Bloomberg, FDIC, IMF, Refinitiv Datastream , J.P.Morgan. Core tier 1 ratios are a measure of banks' financial strength, comparing core tier 1 capital (equity capital and disclosed reserves) against total risk weighted assets. Europe shows average of France, Germany, Italy, Spain and UK. Guide to the Markets Europe. Data as of 31 March 2023.
Accuvest Market Outlook and Positioning
Systemic risk to the financial system may be contained, and a more accommodative Fed is on the horizon, but this does not mean all is rosy in the near term, especially considering that U.S. Leading economic indicators are flashing red, commercial real estate looks vulnerable, financial conditions have tightened, earnings estimates are falling, and margins are likely to come under pressure. As such, we expect a range-bound market in 2023.
Within equities we are positioned defensively with our core US exposure in buffered ETFs. In a rising market, these buffered ETFs are likely to underperform due to their lower beta and upside caps. But when markets are falling, the downside buffer will provide significant protection. This is a trade-off we are happy to take in this uncertain, macro-driven environment. We are overweight international equities as both European and Emerging Market revenue and earnings growth is expected to exceed the US, valuations are much more attractive, and a weakening US dollar is likely to provide an important tailwind.
We are moderately underweight fixed income as we move into Q2. While we believe inflation has peaked, it remains high, therefore eroding real returns. Because of the risk that the window to lock-in high yields may be evaporating, we have incrementally been adding to longer maturity target-term bond funds to our bond ladder.
In alternatives, we continue to value the diversification benefits that commodities bring to portfolios. Should Gold’s recent rally begin to reverse, we will be quick to exit the position and rotate to other areas of the commodity complex that exhibit relative strength.
CST Separately Managed Accounts: Performance Review
Equities
In Equities, our position in GSIE (Goldman ActiveBeta INTL ETF) helped relative performance versus the global benchmark in large part due to an overweight to Western Europe. Our position in GEM (Goldman ActiveBeta EM ETF) outperformed the broader EM indexes but underperformed the global benchmark. Our hedged US equity positions also underperformed.
Fixed Income
In Fixed Income, our short duration profile detracted from performance relative to the longer duration benchmark. As yields fell in response to turmoil in the banking sector and in anticipation of a Fed pause, our short duration positions such as IBHY (iBonds HY 2023 ETF) and IBDP (iBonds IG 2024 ETF) underperformed. On the positive side, (EDD) Morgan Stanley EM Domestic Debt Closed End Fund helped returns as did our position in IVOL (Interest Rate Volatility and Inflation Hedge) due to significant steepening of the yield curve.
Alternatives
Our position in gold (GLD) was greatly rewarded in the month of March, more than making up for its lackluster performance in January and February. While it diversified the portfolio and ended the quarter in the black, it underperformed the major equity and fixed income indexes.
Disclosures: This information was produced by, and the opinions expressed are those of Accuvest as of the date of writing and are subject to change. Any research is based on Accuvest proprietary research and analysis of global markets and investing. The information and/or analysis presented have been compiled or arrived at from sources believed to be reliable, however Accuvest does not make any representation as their accuracy or completeness and does not accept liability for any loss arising from the use hereof. Some internally generated information may be considered theoretical in nature and is subject to inherent limitations associated therein. Any sectors or allocations referenced may or may not be represented in portfolios of clients of Accuvest, and do not represent all of the securities purchased, sold, or recommended for client accounts.
The reader should not assume that any investments in sectors and markets identified or described were or will be profitable. Investing entails risks, including possible loss of principal. The use of tools cannot guarantee performance. The charts depicted within this presentation are for illustrative purposes only and are not indicative of future performance. Past performance is no guarantee of future results. Actual results may vary based on an investor’s investment objectives and portfolio holdings. Investors may need to seek guidance from their legal and/or tax advisor before investing. The information provided may contain projections or other forward-looking statements regarding future events, targets, or expectations, and is only current as of the date indicated. There is no assurance that such events or targets will be achieved and may be significantly different than that shown here. The information presented, including statements concerning financial market trends, is based on current market conditions, which will fluctuate and may be superseded by subsequent market events or for other reasons.